Apple Pre-FY26 Q4 Baseline Audit: 2.24% CapEx/Revenue vs. Hyperscalers' 27.02%–49.53%
In the aligned Apr-Jun 2026 quarter, Apple spent 2.24% of revenue on cash CapEx ($2.455B / $109.417B) while the 4 cloud hyperscalers spent 27.02%-49.53% (and 38.26%-52.54% in Jul-Sep). Here is the $3.534B-$3.599B FY26 Q4 CapEx baseline.
Korea (DART K-IFRS) & Asia Semiconductor Primary-Filing Notes for Global Investors — Cross-Checked With U.S. SEC Disclosures
📊 Launch Interactive Valuation Scorecard & Full Filing Table on Asia Filing Notes →
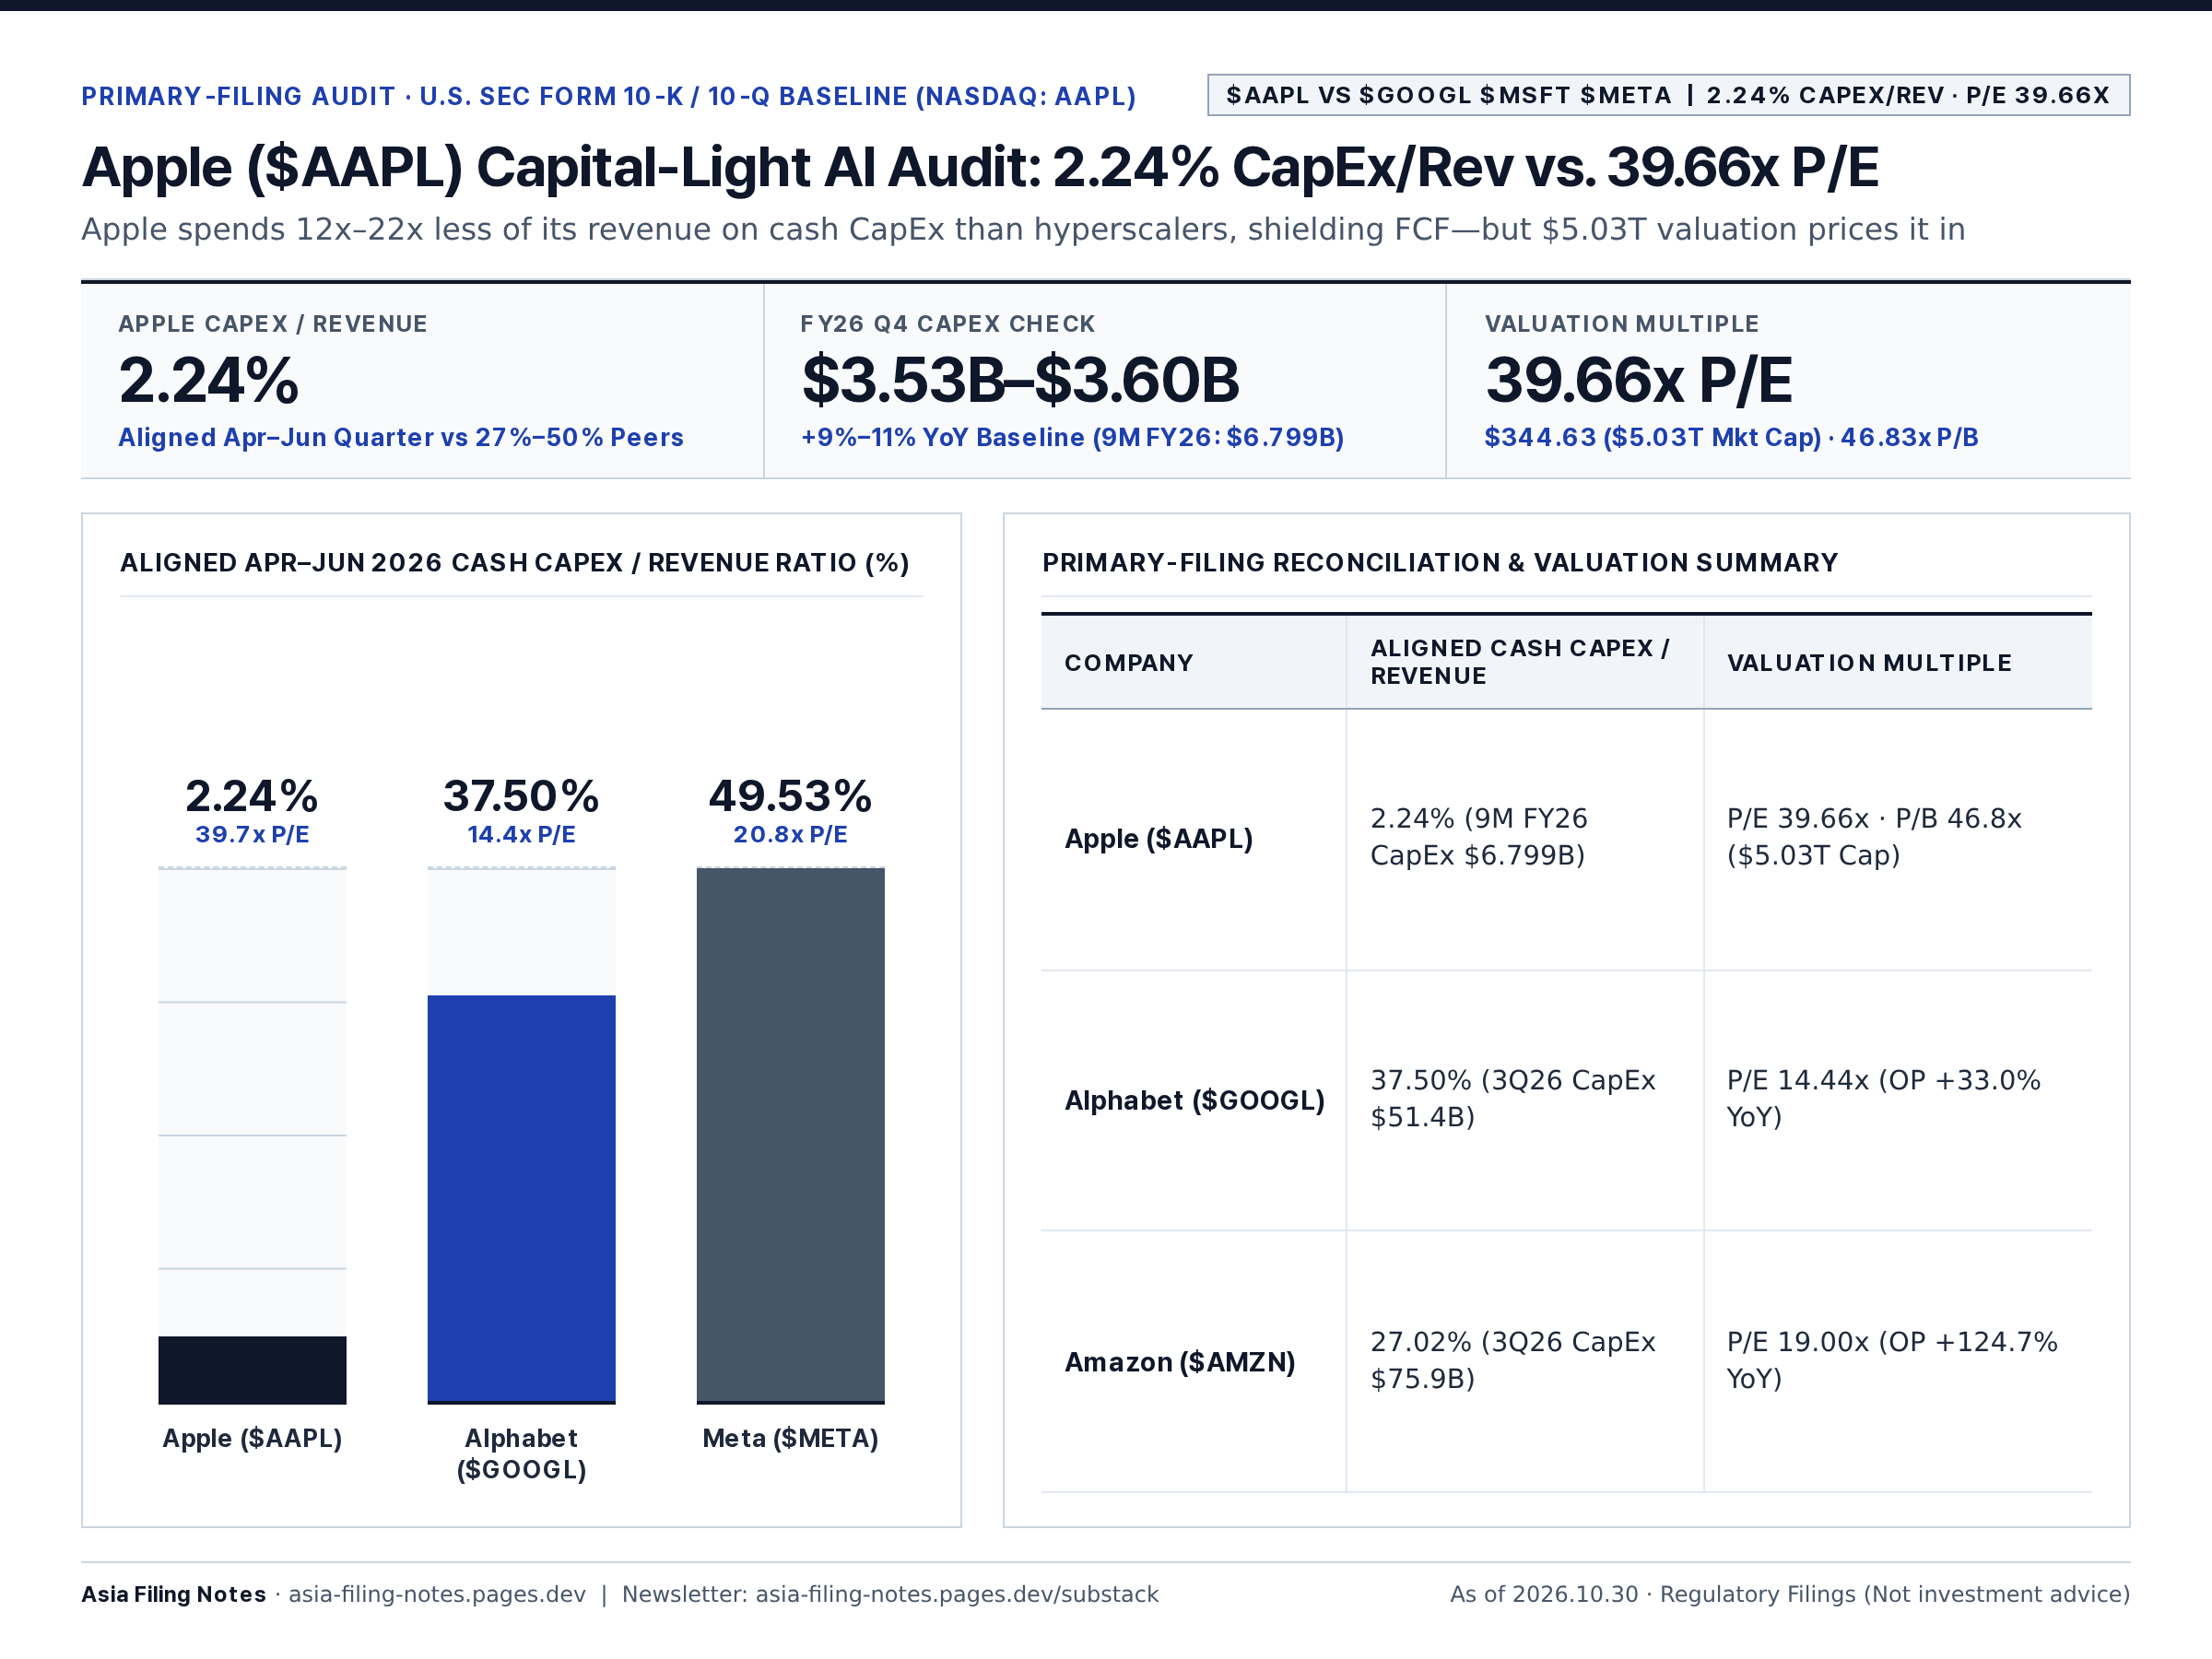
Primary-Filing Valuation Verdict (OVERVALUED PREMIUM (P/E 39.66x · P/B 46.8x) · ▶ NEUTRAL / RANGE-BOUND (Capital-Light Haven, Rich P/E)): Apple's 2.24% CapEx/Revenue Discipline Shields FCF, But 39.66x P/E ($5.03T Cap) Leaves Limited Multiple Upside
Launch Interactive Valuation Scorecard & Full Filing Table on Asia Filing Notes →
3-Step Filing-to-Valuation Summary
- Capital-Light Fact: Aligned Apr–Jun cash CapEx/Revenue: Apple 2.24% vs Big Tech peers at 27.02%–49.53%
- Valuation Estimate: At $344.63 ($5.03T Mkt Cap), AAPL trades at 39.66x P/E & 46.83x P/B — rich vs GOOGL (14.4x)
- 6–12M Direction: ▶ NEUTRAL — FCF shield provides downside protection, but ~40x P/E caps upside without AI revenue acceleration
| Issuer & Live Multiples | Valuation & 6–12M Direction | Primary-Filing Basis & Catalyst |
|---|---|---|
| Apple (AAPL) $344.63 · Mkt Cap $5.03T · P/E 39.66x · CapEx/Rev 2.24% | OVERVALUED (▶ Neutral / Defensive) | Best-in-class FCF preservation, but 39.66x P/E prices in defensive premium fully |
In aligned Apr–Jun 2026 filings, Apple spent 2.24% of revenue on cash CapEx ($2.455B) while the 4 cloud hyperscalers spent 27.02%–49.53% (rising to 38.26%–52.54% in Jul–Sep 2026).
As of 2026.10.30 · Source: Apple FY26 Q2–Q3 & FY25 Q4 Financial Statements, Big Tech SEC XBRL/8-K · Derived ratios marked (Calc.).
1. Pre-FY26 Q4 Guidance Baseline (Call Scheduled Nov 2, 2026)
- Official FY26 Q4 Outlook (from July 30, 2026 Call): Ahead of the Nov 2, 2026 14:00 PT (Nov 3 07:00 KST) release [1], management guided FY26 Q4 revenue growth to +9%–11% YoY, OpEx (R&D + SG&A) to $19.1B–$19.4B, and GPM to 47%–48% (including ~1pp benefit from tariff refund recognition), with no explicit CapEx dollar guide [2].
| Company | Aligned Apr–Jun 2026 Cash CapEx / Revenue (Calc.) |
|---|---|
| Apple (FY26 Q3) | 2.24% ($2.455B / $109.417B) |
| Amazon (2Q26) | 27.02% |
| Alphabet (2Q26) | 37.50% |
| Microsoft (FY26 Q4) | 39.78% |
| Meta Platforms (2Q26) | 49.53% |
2. Hypothesis 1 — 2.24% CapEx/Revenue vs. Hyperscalers & Where Apple Books AI Costs
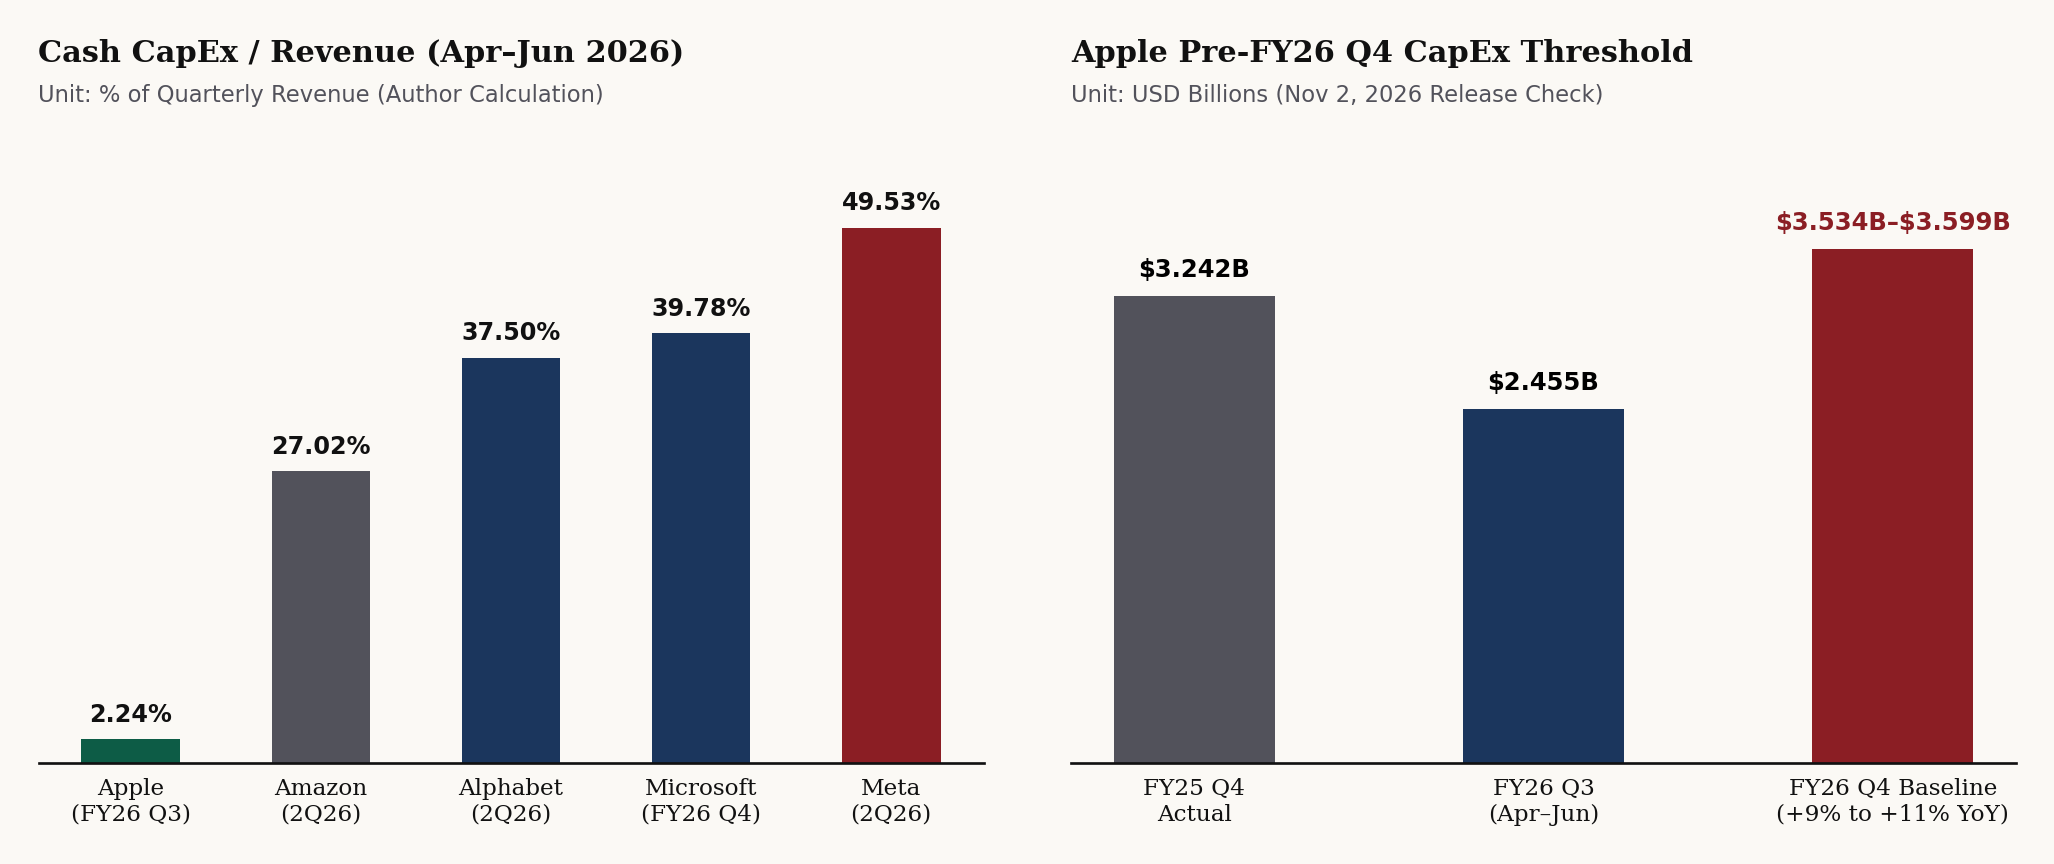
Left: Aligned Apr–Jun 2026 cash CapEx/Revenue across Apple (2.24%) vs. Big Tech peers (27.02%–49.53%). Right: Apple FY25 Q4 cash CapEx ($3.242B) vs. the FY26 Q4 revenue-paced baseline range ($3.534B–$3.599B). Source: Apple financial statements & SEC XBRL/8-K data, author calculations [2][3][4][5][6][8].
- Part 1 (Physical CapEx Intensity — Supported): Subtracting 6M CapEx from 9M26 cumulative CapEx ($6.799B) gives standalone FY26 Q3 (Apr–Jun 2026) cash CapEx of $2.455B on $109.417B revenue = 2.24% CapEx/Revenue (Calc.), vs. 27.02%–49.53% across the 4 hyperscalers in the aligned Apr–Jun quarter [3][4][5]. In Jul–Sep 2026, the 4 hyperscalers rose further to 38.26%–52.54% (Amazon 38.26%, Alphabet 40.25%, Microsoft 42.66%, Meta 52.54%) [5][6].
- Part 2 (Services 75.6% GPM vs. OpEx/COGS AI Blending — Judgment Withheld): While FY26 Q3 Services GPM held at 75.6% (flat YoY) [7], Apple's Q3 10-Q notes R&D ($11.729B, +32% YoY) rose on AI/infrastructure costs and management noted AI outlays also sit in COGS [2][7]. Because third-party cloud and AI costs are not broken out, Part 2 cannot be tested from current filings.
3. Hypothesis 2 — The $3.534B–$3.599B FY26 Q4 CapEx Baseline
- Revenue-Paced Baseline Math:
1)FY25 Q4 Standalone Cash CapEx = FY25 Full-Year ($12.715B) - FY25 9M ($9.473B) = $3.242B[3][8].
2)FY26 Q4 Baseline (scaling $3.242B by guided +9%~11% YoY revenue growth) = $3.534B to $3.599B(Calc., compared againstFY26 Full-Year CapEx - $6.799B 9M26 CapEx) [2][3][8].
Takeaway & FY26 Q4 Verification Checklist
- When FY26 Q4 Drops: (1) Check standalone Q4 cash CapEx against $3.534B–$3.599B (re-anchoring if actual revenue growth lands outside 9%–11% YoY); (2) Check if CapEx/Revenue stays near ~2–3% vs. the 38.26%–52.54% hyperscaler band [6]; (3) Check any FY27 Q1 CapEx commentary.
Sources
- Apple Investor Relations: FY26 Q4 Earnings Release & Call Schedule, accessed 2026.10.30.
- The Motley Fool: Apple (AAPL) Q3 2026 Earnings Call Transcript (Call held 2026.07.30), published 2026.08.07.
- Apple FY26 Q3 Condensed Consolidated Financial Statements (PDF), 2026.07.30.
- Apple FY26 Q2 Condensed Consolidated Financial Statements (PDF, 6M Cash Flows), 2026.04.30.
- SEC EDGAR XBRL Company Facts API: Microsoft, Alphabet, Amazon, Meta Platforms, accessed 2026.10.30.
- Jul–Sep 2026 Earnings Releases (Form 8-K Exhibit 99.1): Microsoft (2026.10.28), Alphabet (2026.10.28), Amazon (2026.10.29), Meta (2026.10.21).
- Apple Form 10-Q for the Quarterly Period Ended June 27, 2026 (MD&A Gross Margin & R&D), 2026.07.31.
- Apple FY25 Q4 Condensed Consolidated Financial Statements (PDF), 2025.10.30.
Explore the Full Interactive Filing Audit & Peer Scorecard
Read the complete interactive edition—including live valuation gauges, downloadable K-IFRS / SEC Form 10-Q reconciliation tables, and direct DART receipt (rcpNo) & EDGAR links—on our primary research portal:
Personal analysis record based on public regulatory filings. Not investment advice or a solicitation to buy or sell any security.