3Q26 CapEx Cycle 4-Signal Audit: D&A, CIP, Contract Liabilities & SK Hynix's -32.6T KRW Non-Op Swing
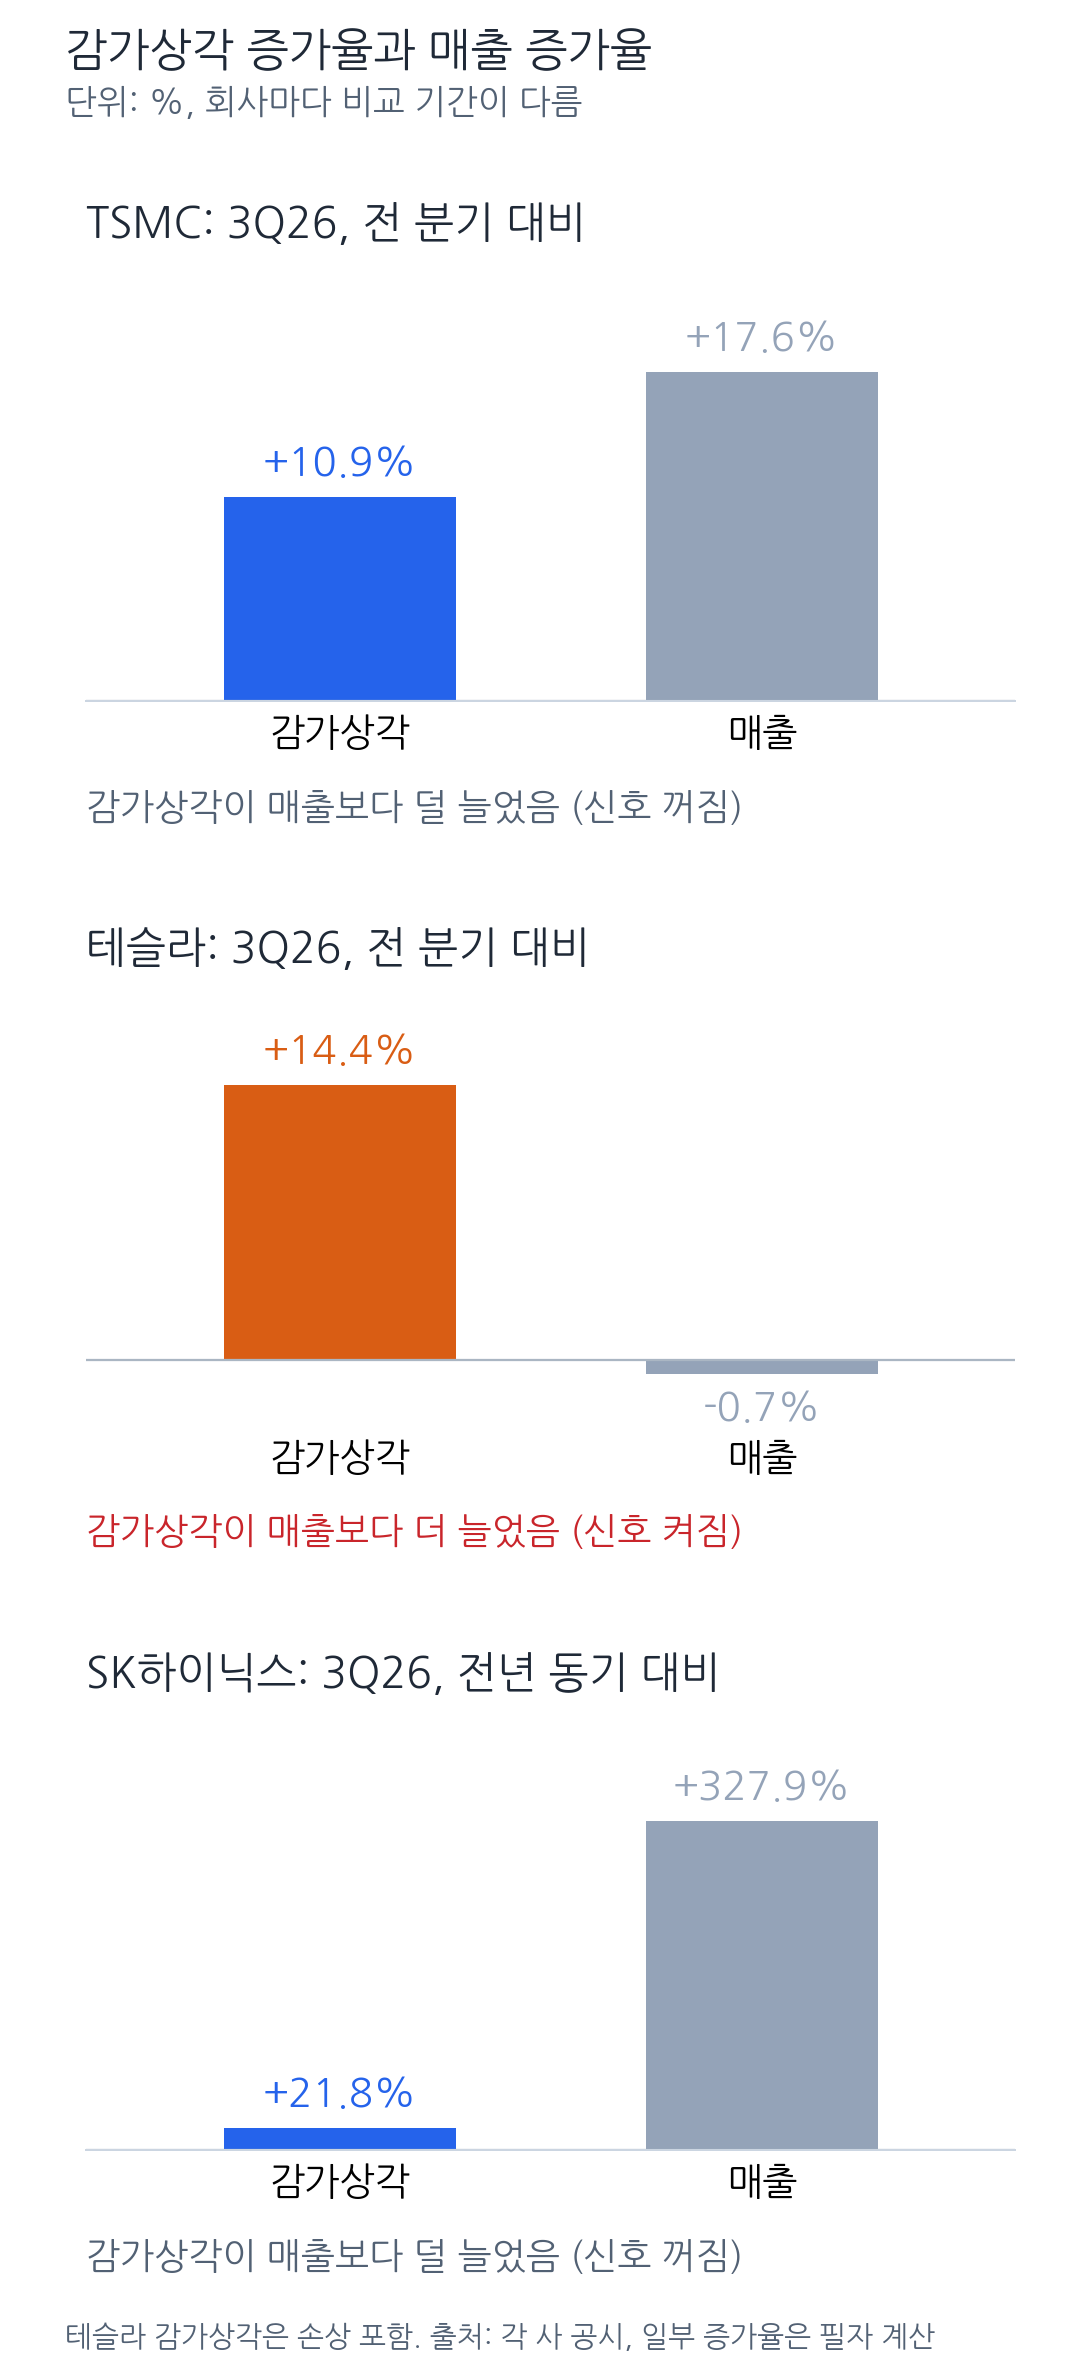
Auditing 4 cycle indicators across TSMC, SK Hynix, and Tesla: only Tesla triggered D&A > Revenue growth (+14.4% vs -0.7% QoQ), while SK Hynix's 3Q IR deck breaks down its -32.6T KRW non-operating swing (11.63T FX loss + 22.92T investment valuation loss).
Korea (DART K-IFRS) & Asia Semiconductor Primary-Filing Notes for Global Investors — Cross-Checked With U.S. SEC Disclosures
📊 Launch Interactive Valuation Scorecard & Full Filing Table on Asia Filing Notes →
Primary-Filing Valuation Verdict (UNDERVALUED Upstream vs OVERVALUED Tesla (370x P/E) · ▲ BULLISH Hynix·TSMC / ▼ CAUTIOUS Tesla): Upstream Suppliers (Rev Growth >> D&A Growth) Are Undervalued; Downstream Tesla (D&A > Rev Growth, 370x P/E) Is Overvalued
Launch Interactive Valuation Scorecard & Full Filing Table on Asia Filing Notes →
3-Step Filing-to-Valuation Summary
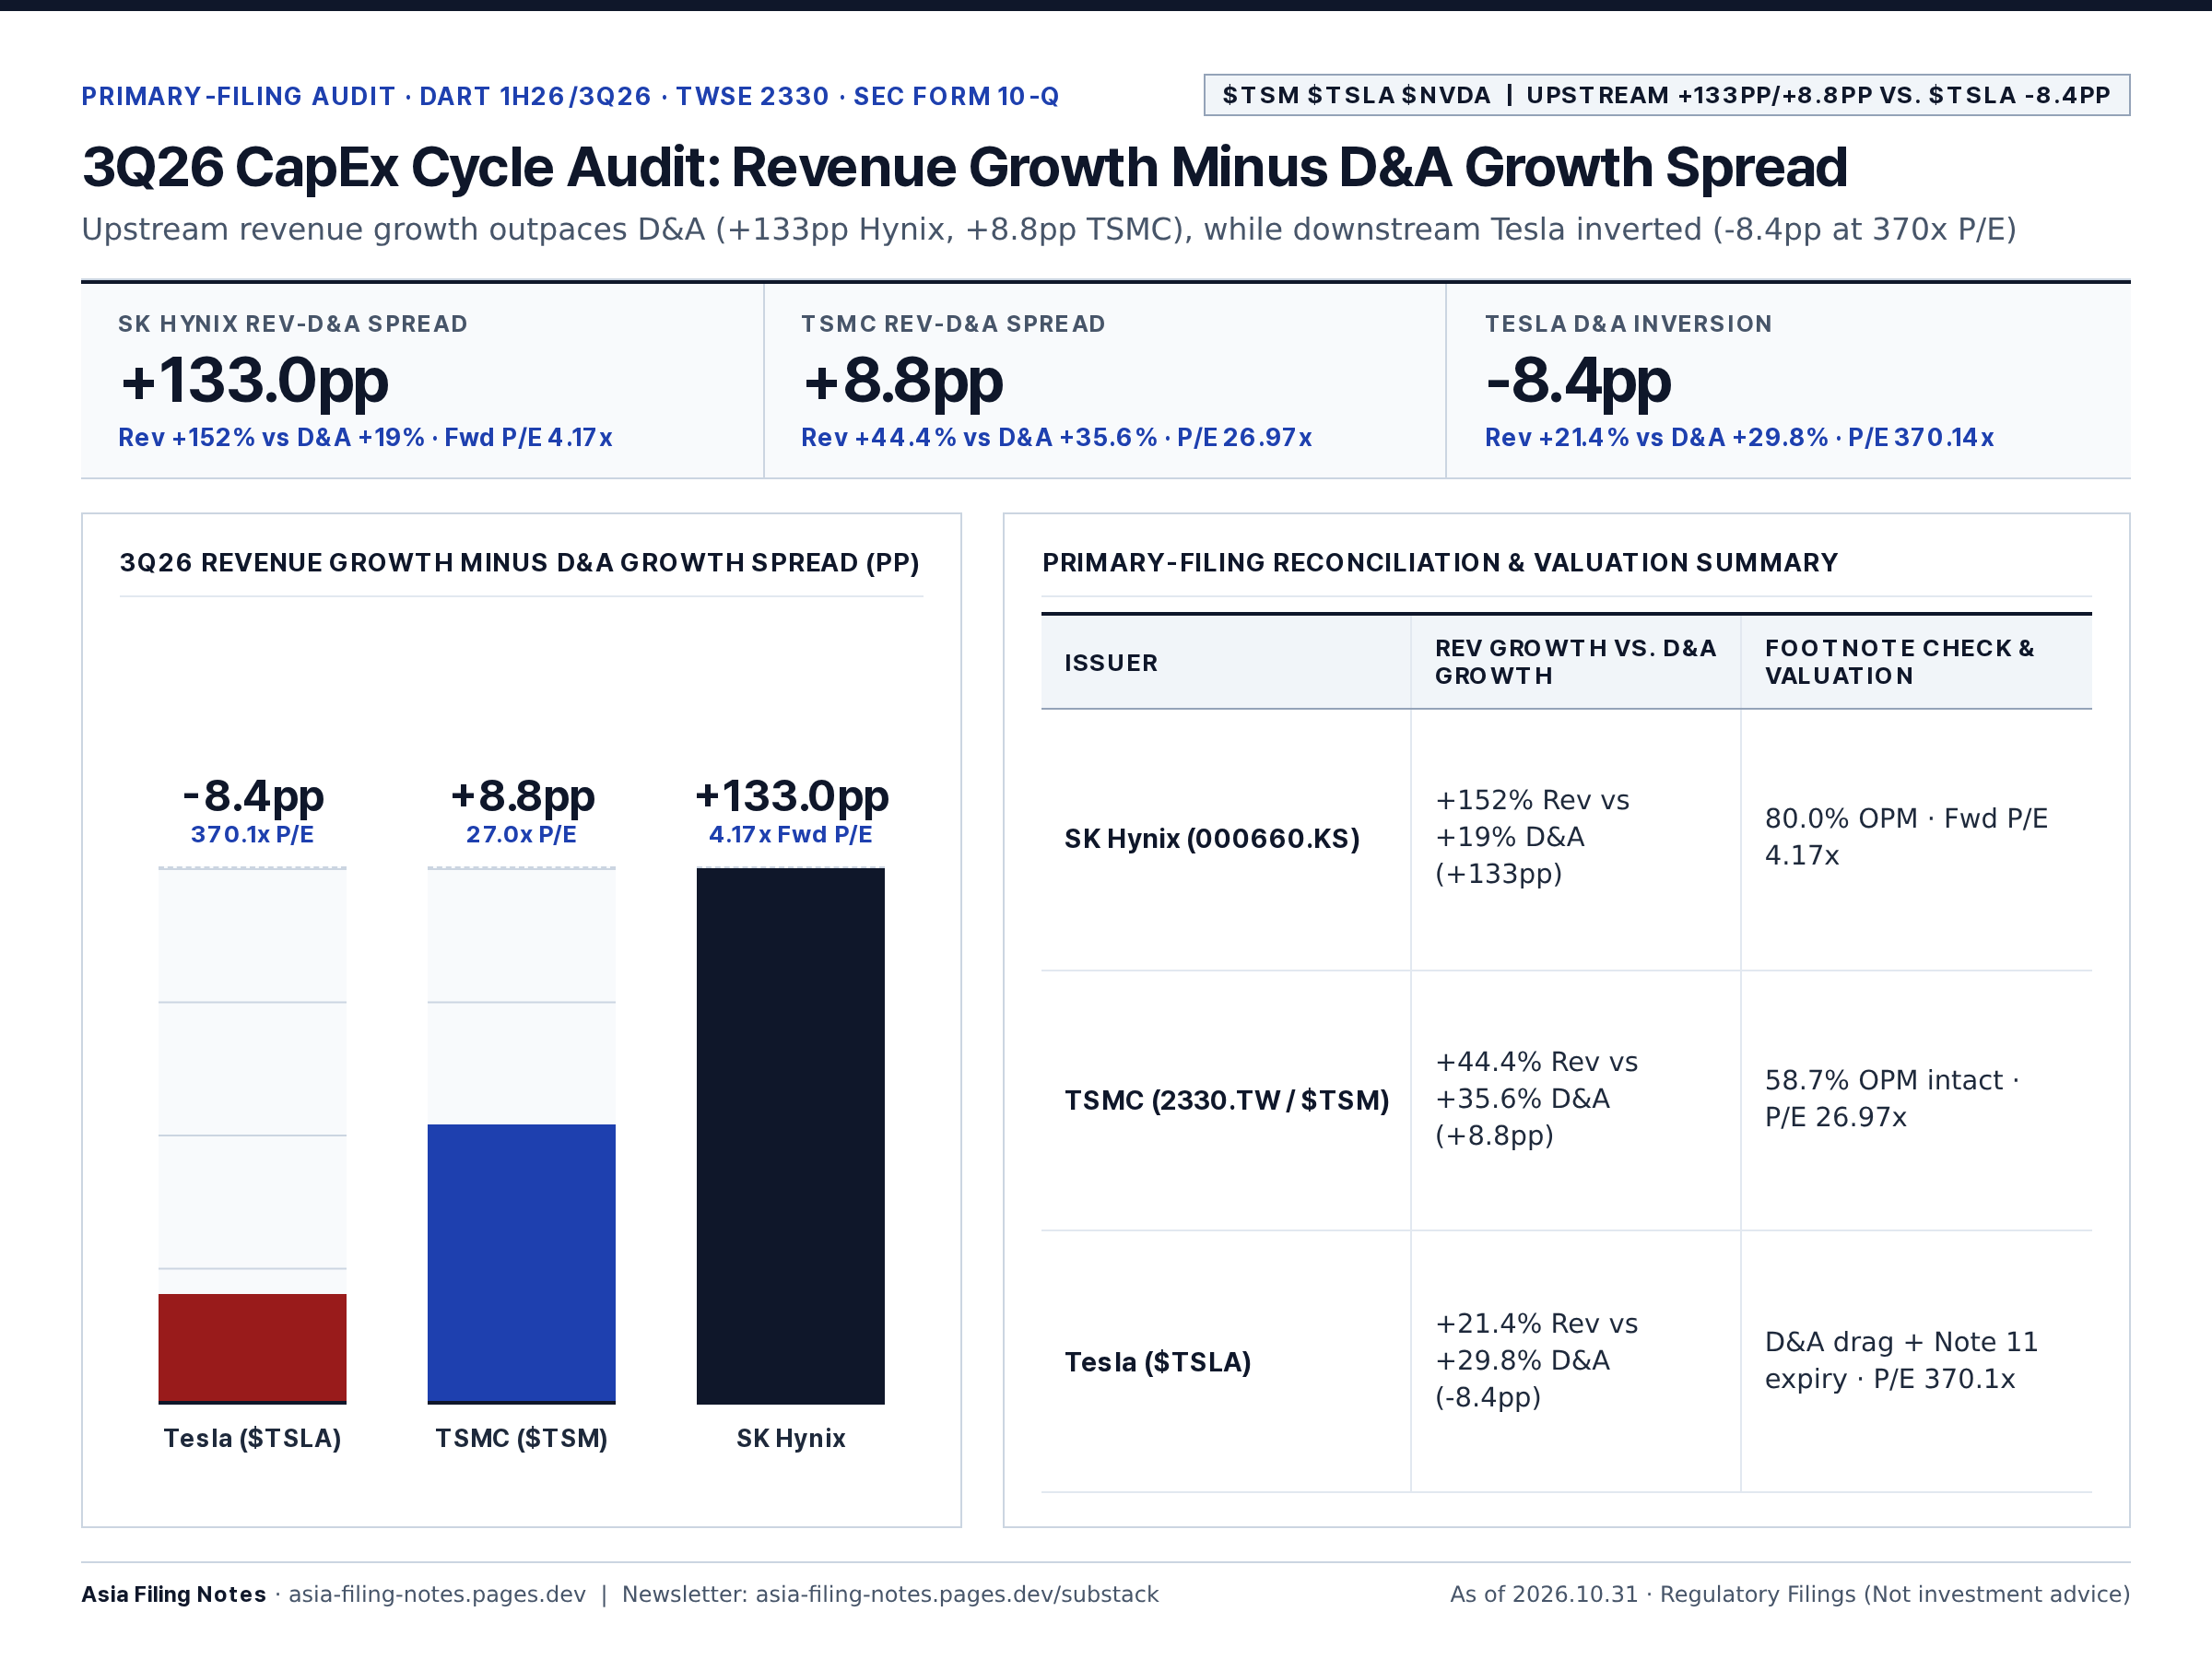
- 4-Signal Fact: Rev Growth minus D&A Growth spread: SK Hynix +133pp, TSMC +8.8pp vs Tesla -8.4pp (inverted)
- Valuation Estimate: SK Hynix (4.17x Fwd P/E) & TSMC (26.97x P/E) Undervalued vs Tesla (370.1x P/E) Overvalued
- 6–12M Direction: ▲ BULLISH on upstream operating leverage / ▼ CAUTIOUS on downstream D&A drag
| Issuer & Live Multiples | Valuation & 6–12M Direction | Primary-Filing Basis & Catalyst |
|---|---|---|
| SK Hynix (000660.KS) Fwd P/E 4.17x · Rev +152% vs D&A +19% (+133pp spread) | UNDERVALUED (▲ Bullish) | Revenue grows 8x faster than D&A, keeping forward multiple at deep-value 4.17x |
| TSMC (2330.TW / TSM) P/E 26.97x · Rev +44.4% vs D&A +35.6% (+8.8pp spread) | UNDERVALUED (▲ Bullish) | Top-line growth (+44.4%) cleanly absorbs N2 D&A (+35.6%) at 27.0x P/E |
| Tesla (TSLA) P/E 370.14x · Rev +21.4% vs D&A +29.8% (-8.4pp spread) | OVERVALUED (▼ Cautious) | D&A outpacing revenue growth while trading at 370.1x P/E signals valuation headwind |
Among 3Q26 filings, only Tesla saw D&A outpace revenue (+14.4% vs. -0.7% QoQ), while SK Hynix's 3Q IR deck resolves the -32.6T KRW non-operating swing behind its QoQ net income drop.
As of 2026.10.30 · Source: SK Hynix DART 1H26 Report & 3Q26 IR Deck, TSMC 3Q26 FS/Management Report & Tesla 3Q26 10-Q · Derived ratios marked (Calc.).
1. Signal 1 — D&A Growth vs. Revenue Growth (Peak-Margin Trigger)
- Disclosure Scope: TSMC 3Q26 FS/Management Report cover D&A and inventory days [1][2]; SK Hynix 3Q26 D&A/inventory come from its 3Q26 IR deck while CIP/contract liabilities come from its 1H26 DART Semi-Annual Report (as of June 30, 2026) [10][12]; Tesla covers all four in its 3Q26 Form 10-Q [4].
- TSMC (Signal OFF): 3Q26 D&A +10.9% QoQ vs. revenue +17.6% QoQ (-6.7%p gap) [1][2]. GPM still dipped 67.7% → 66.4% on initial 2nm ramp dilution.
- SK Hynix (Signal OFF): 3Q26 D&A +21.8% YoY (+7.6% QoQ) vs. revenue +327.9% YoY (+31.9% QoQ) (2Q26: D&A +17.0% vs. rev +256.8% YoY); OPM rose 76% → 80% [8][10][11][12].
- Tesla (Signal ON): Total D&A + impairment +14.4% QoQ vs. revenue -0.7% QoQ (+15.1%p gap); Note 5 pure depreciation ($1.58B) +17.0% YoY vs. revenue -0.2% YoY (2Q26 was off: +19.1% D&A vs. +25.5% rev YoY) [4][5][6]. Headline GAAP OPM rose 1.41% (2Q26) → 2.56% (3Q26) (vs. 5.66% 4Q25, 4.20% 1Q26, 5.78% 3Q25), but stripping Note 11 IEEPA tariff refunds ($786M COGS reduction across $526M Energy + $260M Auto, minus $339M Energy customer refund) drops 3Q26 OPM to ~0.95% (< 2Q26's 1.41%) [4][5].
| Company & Filing | Verified CapEx-Cycle & Below-OP Figures |
|---|---|
| TSMC (2330.TW, 3Q26) | D&A +10.9% QoQ vs. revenue +17.6% QoQ (-6.7%p gap, signal off); Inventory days fell from 87 days to 82 days [1][2] |
| SK Hynix (000660.KS, 3Q26 & 1H26 DART) | 3Q D&A +21.8% YoY vs. revenue +327.9% YoY (+7.6% vs. +31.9% QoQ, signal off); 1H26 CIP 20.83T KRW (-4.2% vs. year-end); 1H26 Contract Liabilities ~523.5B KRW (+10.4%) [10][12] |
| SK Hynix Below-OP Line (3Q26 IR Deck) | 3Q non-operating loss ~-32.6T KRW (vs. ~+62.2T in 2Q26): driven by 11.63T KRW FX loss + 22.92T KRW investment-asset loss (34.55T KRW combined) [9][12] |
| Tesla (TSLA, 3Q26 10-Q) | D&A/impairment +14.4% QoQ vs. revenue -0.7% QoQ (Note 5 D&A $1.58B, +17.0% YoY vs. revenue -0.2% YoY, signal ON); CIP $11.211B (+31.4% QoQ); Deferred revenue $4.661B (+36.0% QoQ); Ex-tariff OPM ~0.95% (vs. 2.56% rep.) [4][5] |
2. Signals 2–4 — CIP, Contract Liabilities & Inventory Days
- SK Hynix 1H26 CIP & DART Utilization Caveat: 1H26 CIP was 20.83T KRW (-4.2% vs. year-end) [10]; 3Q26 DRAM bit shipments rose ~10% QoQ while NAND bits edged down [12]. DART nuance: the "100% average utilization" in the 1H26 report is operating hours ÷ available hours (and printed capacity of 24.15T KRW equals actual cost-basis output), not physical wafer capacity [10].
- Tesla CIP Surge: CIP jumped +31.4% QoQ to $11.211B at Sept 30, 2026 even as Texas Model Y capacity expanded (>250,000 → >375,000 units/yr) and Texas Megapack entered production [4][5][7] → new projects entering CIP outpaced line completions.
- Contract Liabilities vs. LTAs: Tesla current deferred revenue rose +36.0% QoQ to $4.661B [5]. SK Hynix 1H26 contract liabilities rose +10.4% YTD to ~523.5B KRW (cash prepayments received, distinct from the >50% 2027–2028 LTA volume commitments) [8][10].
- Inventory Days: Raw inventory balances rose QoQ at all three, but TSMC inventory turnover days fell from 87 days (2Q26) to 82 days (3Q26) on higher wafer shipments [1].
3. Resolving SK Hynix's -32.6T KRW Non-Operating Swing
- 2Q26 vs. 3Q26 Non-Operating Bridge: While 3Q26 OP rose +38% QoQ to 83.33T KRW (80% OPM), net profit fell -58% QoQ to 39.78T KRW because net non-operating income swung from ~+62.2T KRW (2Q26) to ~-32.6T KRW (3Q26) (Calc. from DART table) [9].
- Exact IR Breakdown (Page 6 of 3Q26 IR Deck): Driven by two items totaling 34.55T KRW: (1) 11.63T KRW FX-related loss from exchange-rate decline + (2) 22.92T KRW investment-asset valuation loss (remaining net non-op items slightly positive) [12]. Next check: specific investment assets in the full Q3 DART report footnotes [3].
Takeaway & Next-Quarter Checks
- Core Verdict:
Upstream (TSMC/SK Hynix) = D&A Signal OFF, Turnover Improving (87d → 82d) | Downstream (Tesla) = D&A Signal ON (+14.4% vs. -0.7% rev QoQ), Ex-Refund OPM ~0.95%.
Sources
- TSMC 3Q26 Management Report (PDF, pp. 1–2, 4), 2026.10.15.
- TSMC 3Q26 Consolidated Financial Statements (FS.pdf, pp. 2, 4), 2026.10.15.
- TSMC SEC EDGAR Form 6-K Filing Index, accessed 2026.10.30.
- Tesla Q3 2026 Form 10-Q (Notes 1, 5 & 11), 2026.10.22.
- Tesla Q3 2026 Update (Form 8-K Exhibit 99.1), 2026.10.21.
- Tesla Q2 2026 Form 10-Q (Note 5), 2026.07.23.
- Tesla Q2 2026 Update (Form 8-K Exhibit 99.1), 2026.07.22.
- SK Hynix Newsroom: 3Q 2026 Business Results, 2026.10.28.
- DART SK Hynix Preliminary 3Q26 Earnings Fair Disclosure, 2026.10.28.
- DART SK Hynix 2026 Semi-Annual Report (1H26 CIP, Utilization & Contract Liabilities), 2026.08.14.
- SK Hynix Newsroom: 2Q 2026 Business Results, 2026.07.29.
- SK Hynix FY2026 Q3 Earnings IR Presentation (PDF, pp. 4, 6, 16, 19–20), 2026.10.28.
Explore the Full Interactive Filing Audit & Peer Scorecard
Read the complete interactive edition—including live valuation gauges, downloadable K-IFRS / SEC Form 10-Q reconciliation tables, and direct DART receipt (rcpNo) & EDGAR links—on our primary research portal:
Personal analysis record based on public regulatory filings. Not investment advice or a solicitation to buy or sell any security.