TSMC 3Q26 Audit: 2026 Growth Guided to ~44%, 66.4% GPM During N2 Ramp & $60B–$64B CapEx Discipline
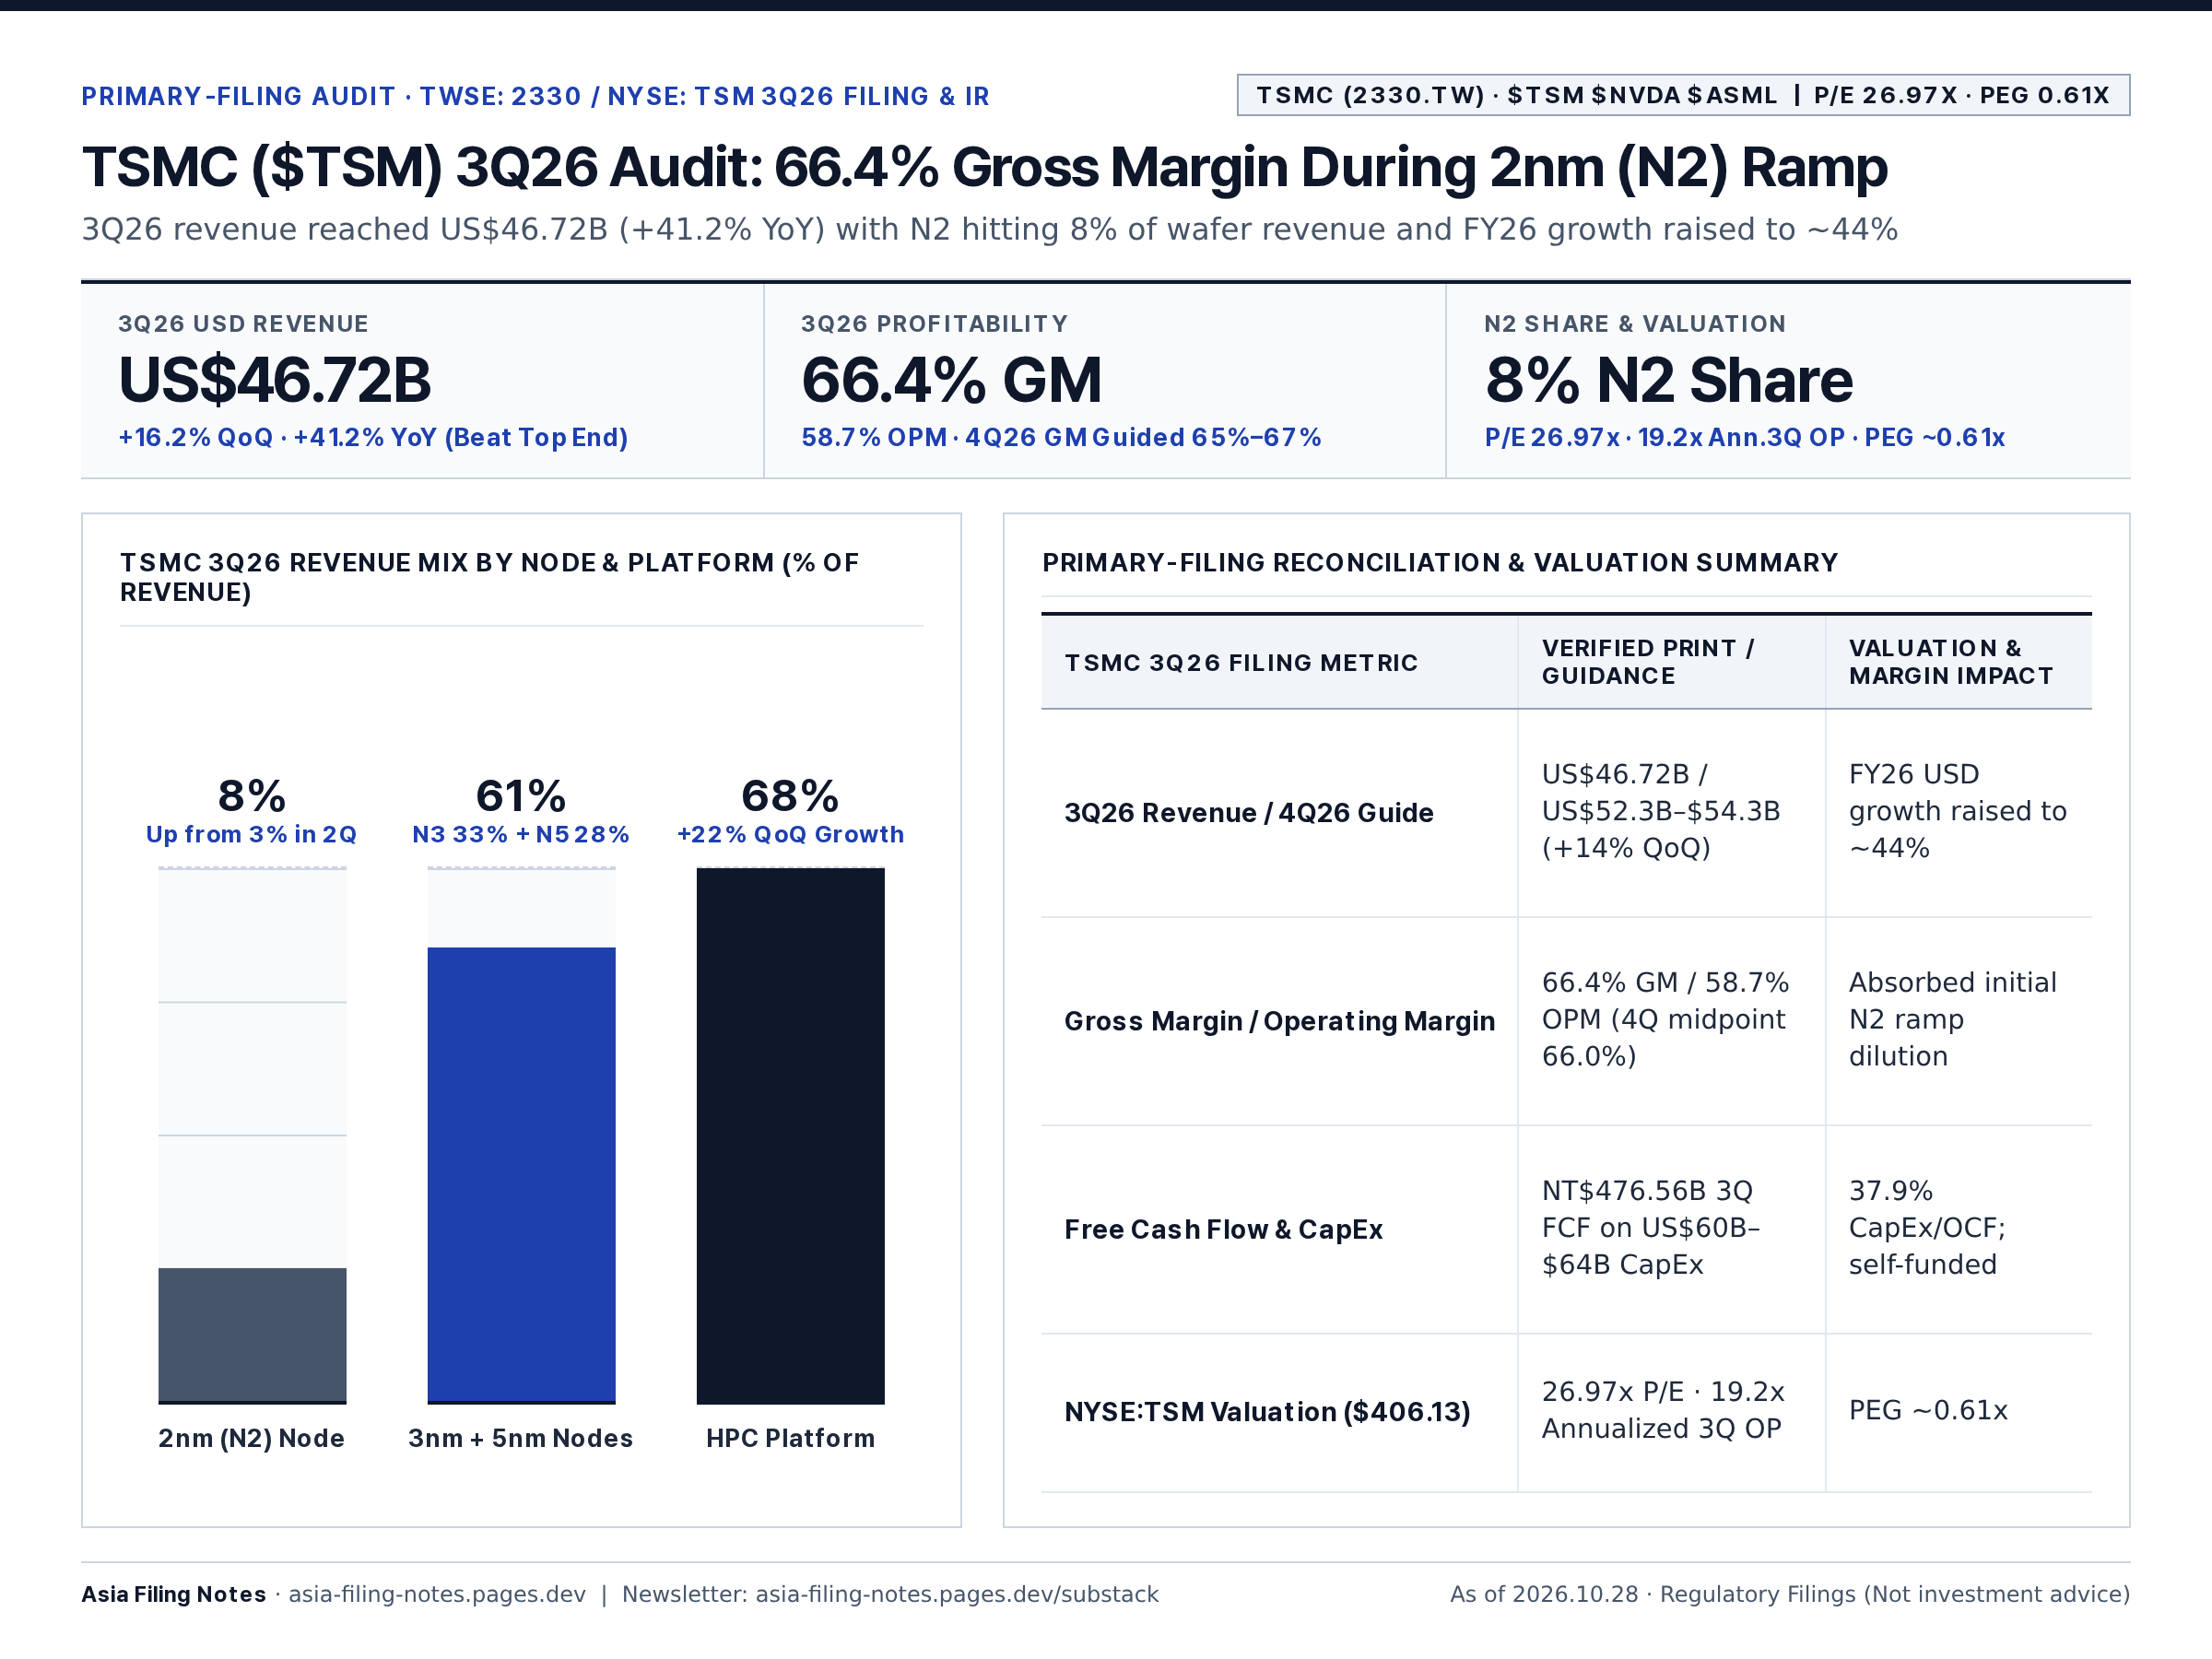
TSMC 3Q26 revenue hit US$46.72B (+16.2% QoQ, +41.2% YoY) with 66.4% GPM and 58.7% OPM as 2nm reached 8% of wafer revenue. 4Q26 guides US$53.3B midpoint (+14% QoQ) and 66.0% GPM while keeping FY26 CapEx at US$60B-$64B.
Korea (DART K-IFRS) & Asia Semiconductor Primary-Filing Notes for Global Investors — Cross-Checked With U.S. SEC Disclosures
📊 Launch Interactive Valuation Scorecard & Full Filing Table on Asia Filing Notes →
Primary-Filing Valuation Verdict (UNDERVALUED (P/E 26.97x · PEG ~0.61x) · ▲ BULLISH (+44% FY26 Growth · 67% 4Q GM Guide)): At 26.97x P/E Against ~44% USD Revenue Growth and 58.7% OPM (PEG ~0.61x), TSMC Remains Undervalued
Launch Interactive Valuation Scorecard & Full Filing Table on Asia Filing Notes →
3-Step Filing-to-Valuation Summary
- 3Q26 Filing Fact: $46.72B Rev (+44.4% YoY), 66.4% GM, 58.7% OPM, N2 wafer share reaching 8%
- Valuation Estimate: NYSE:TSM ($406.13) trades at 26.97x P/E · 19.2x Annualized 3Q OP · ~0.61x PEG
- 6–12M Direction: ▲ BULLISH — 4Q26 guidance (67.0% midpoint GM, 59.5% OPM) confirms N2 pricing power
| Issuer & Live Multiples | Valuation & 6–12M Direction | Primary-Filing Basis & Catalyst |
|---|---|---|
| TSMC (2330.TW / TSM) Mkt Cap $2.11T · P/E 26.97x · Cap/Ann.3Q OP 19.2x · PEG 0.61x | UNDERVALUED (▲ Bullish) | Monopoly AI foundry compounding at ~44% YoY while trading at a market-average 27.0x P/E |
TSMC raised 2026 USD revenue growth guidance to ~44%, held 66.4% GPM during the initial 2nm ramp (8% of wafer sales), and kept FY26 CapEx unchanged at US$60B–$64B.
As of 2026.10.28 · Source: TSMC 3Q26 Earnings Release, Management Report, Presentation & Transcript (2026.10.15) · Derived ratios marked (Calc.).
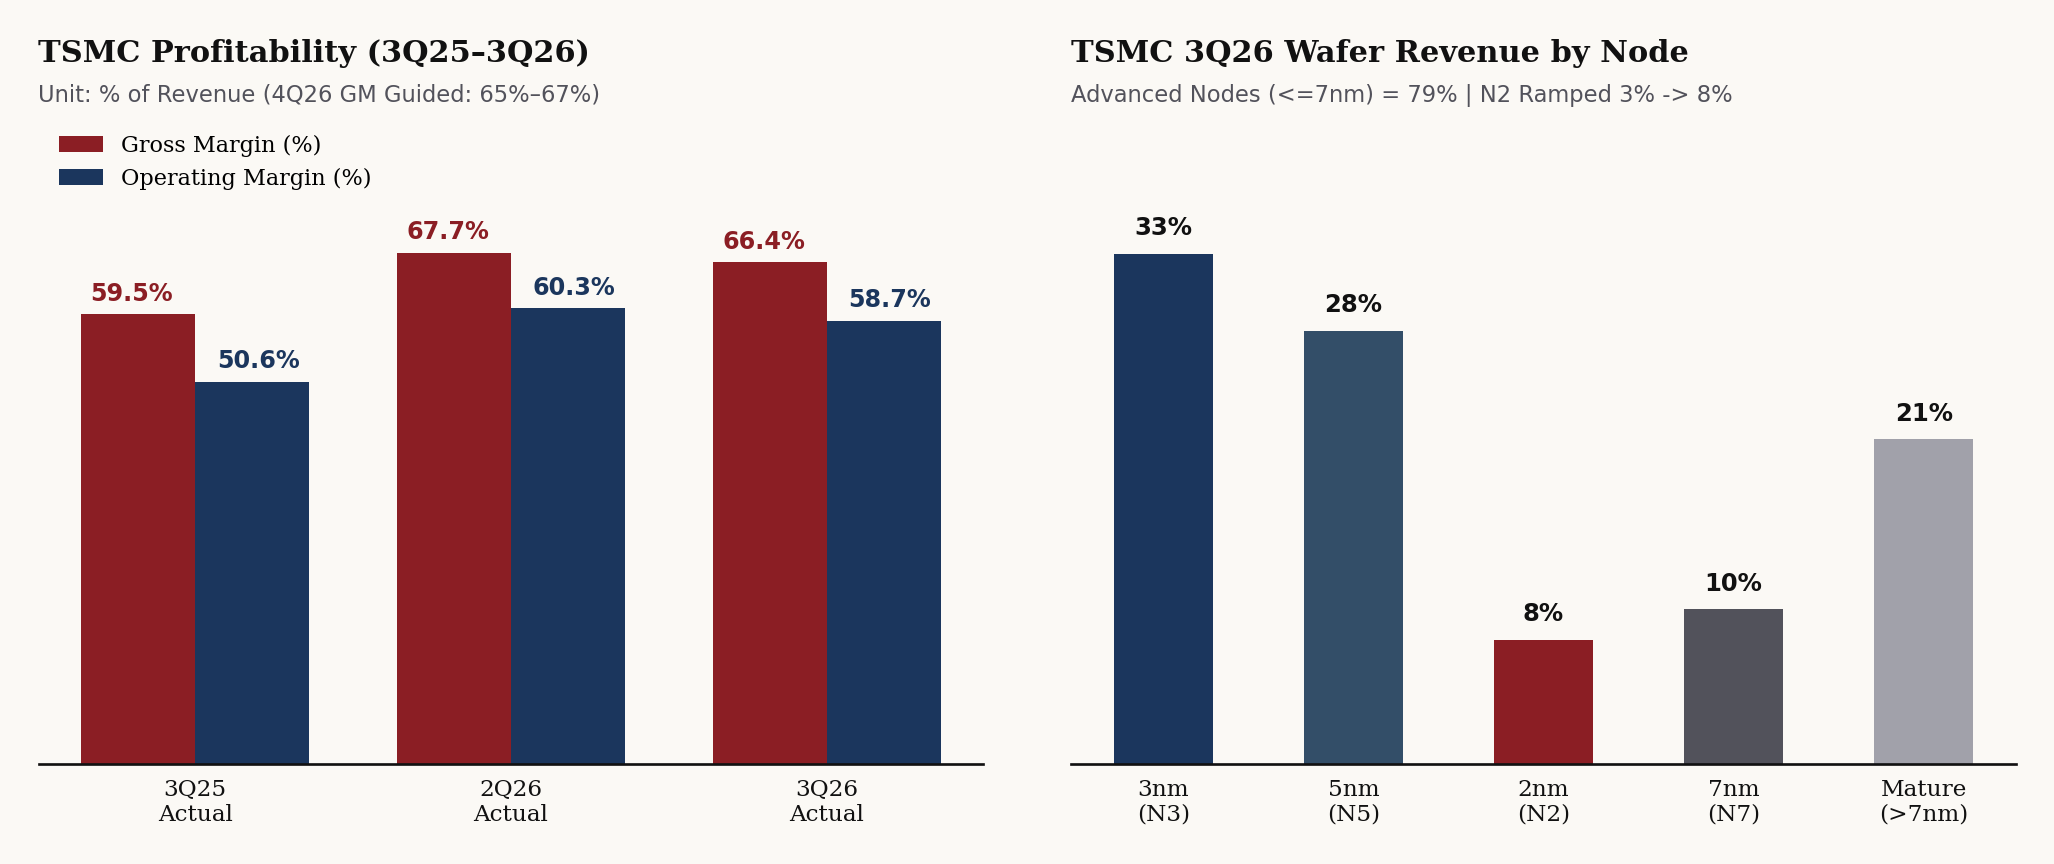
Left: TSMC quarterly gross and operating margin progression through 4Q26 guidance midpoint. Right: 3Q26 wafer revenue mix by node (≤7nm = 79%). Source: TSMC 3Q26 releases [1][2][3].
1. 3Q26 Results & 4Q26 / FY26 Guidance
- 3Q26 Beat & Margin Resilience: Revenue reached US$46.72B (+16.2% QoQ, +41.2% YoY), beating the US$45.8B upper guidance bound [1][2]. GPM printed 66.4% (-1.3pp QoQ from 67.7% on initial N2 mass-production dilution, but inside the 65%–67% guide and +6.9pp YoY vs. 59.5%); OPM printed 58.7% (vs. 60.3% in 2Q26 and 50.6% in 3Q25) [2].
- 4Q26 & Full-Year 2026 Outlook: 4Q26 revenue guided to US$52.3B–$54.3B (midpoint US$53.3B, +14% QoQ); 4Q26 GPM guided to 65%–67% (midpoint 66.0%, -40bp QoQ) [1][4]. Full-year 2026 USD revenue growth raised from ">40%" to ~44% [3].
- Overseas Fab Dilution & CoWoS Roadmap: Overseas fab ramp dilution is guided at ~2pp in 2026, widening to 3–4pp/year in subsequent years [4]. Management noted 2024–2029 AI accelerator CAGR will likely exceed the prior mid-to-high-50% guide and is preparing 9x and 14x reticle-size large-substrate CoWoS packaging [4].
| Item | Disclosed & Guided Figures |
|---|---|
| 3Q26 Revenue | US$46.72B (+16.2% QoQ, +41.2% YoY; above the prior guidance top end of US$45.8B) |
| 3Q26 Profitability | Gross margin 66.4% (-1.3%p QoQ, +6.9%p YoY), operating margin 58.7% |
| 4Q26 Guidance | Revenue US$52.3B–$54.3B (midpoint US$53.3B), gross margin 65%–67% (midpoint 66.0%) |
| Full-Year 2026 Outlook | USD revenue growth of ~44% (raised from prior guidance of above 40%) |
| Node & Platform Mix | ≤7nm wafer revenue share 79% (3nm 33%, 5nm 28%, 2nm 8%), HPC share 68% |
| CapEx & Cash Flow | 2026 CapEx budget kept at US$60B–$64B (3Q26 spend US$13.84B), free cash flow NT$476.56B |
2. Platform & Wafer Node Mix: HPC 68%, ≤7nm 79%, N2 Jumps to 8%
- Platform Mix: HPC grew +22% QoQ to 68% of revenue (up from 66% in 2Q26); Smartphone rose +10% QoQ while its share edged down 22% → 21% [2].
- Wafer Node Mix: Advanced nodes (≤7nm) = 79% of wafer revenue: 3nm = 33% (overtaking 5nm = 28%; 7nm = 10%), while 2nm (N2) jumped from 3% (2Q26) to 8% (3Q26) in a single quarter [2][3].
3. Capital Discipline: US$60B–$64B CapEx Budget Unchanged
- Cash Flow & CapEx Math: Despite excess AI demand, FY26 CapEx guidance stayed locked at US$60B–$64B (3Q26 CapEx US$13.84B; 9M26 cumulative US$40.64B) [2][3][4]. In NTD:
3Q26 OCF (NT$919.77B) - CapEx (NT$443.21B) = NT$476.56B FCF[2].
Takeaway & Next-Quarter Checks
- Core Thesis:
N2 Share 3% → 8% With Only -130bp GPM Dip (66.4%) + 4Q Midpoint 66.0% => Leading-Edge Pricing Absorbs Depreciation. - 4Q26 Checks: (1) N2 depreciation absorption as wafer share scales above 8%; (2) Overseas fab dilution trajectory (2pp → 3–4pp).
Sources
- TSMC 3Q26 Earnings Release, 2026.10.15.
- TSMC 3Q26 Quarterly Management Report, 2026.10.15.
- TSMC 3Q26 Earnings Conference Presentation, 2026.10.15.
- TSMC 3Q26 Earnings Conference Transcript, 2026.10.15.
Explore the Full Interactive Filing Audit & Peer Scorecard
Read the complete interactive edition—including live valuation gauges, downloadable K-IFRS / SEC Form 10-Q reconciliation tables, and direct DART receipt (rcpNo) & EDGAR links—on our primary research portal:
Personal analysis record based on public regulatory filings. Not investment advice or a solicitation to buy or sell any security.