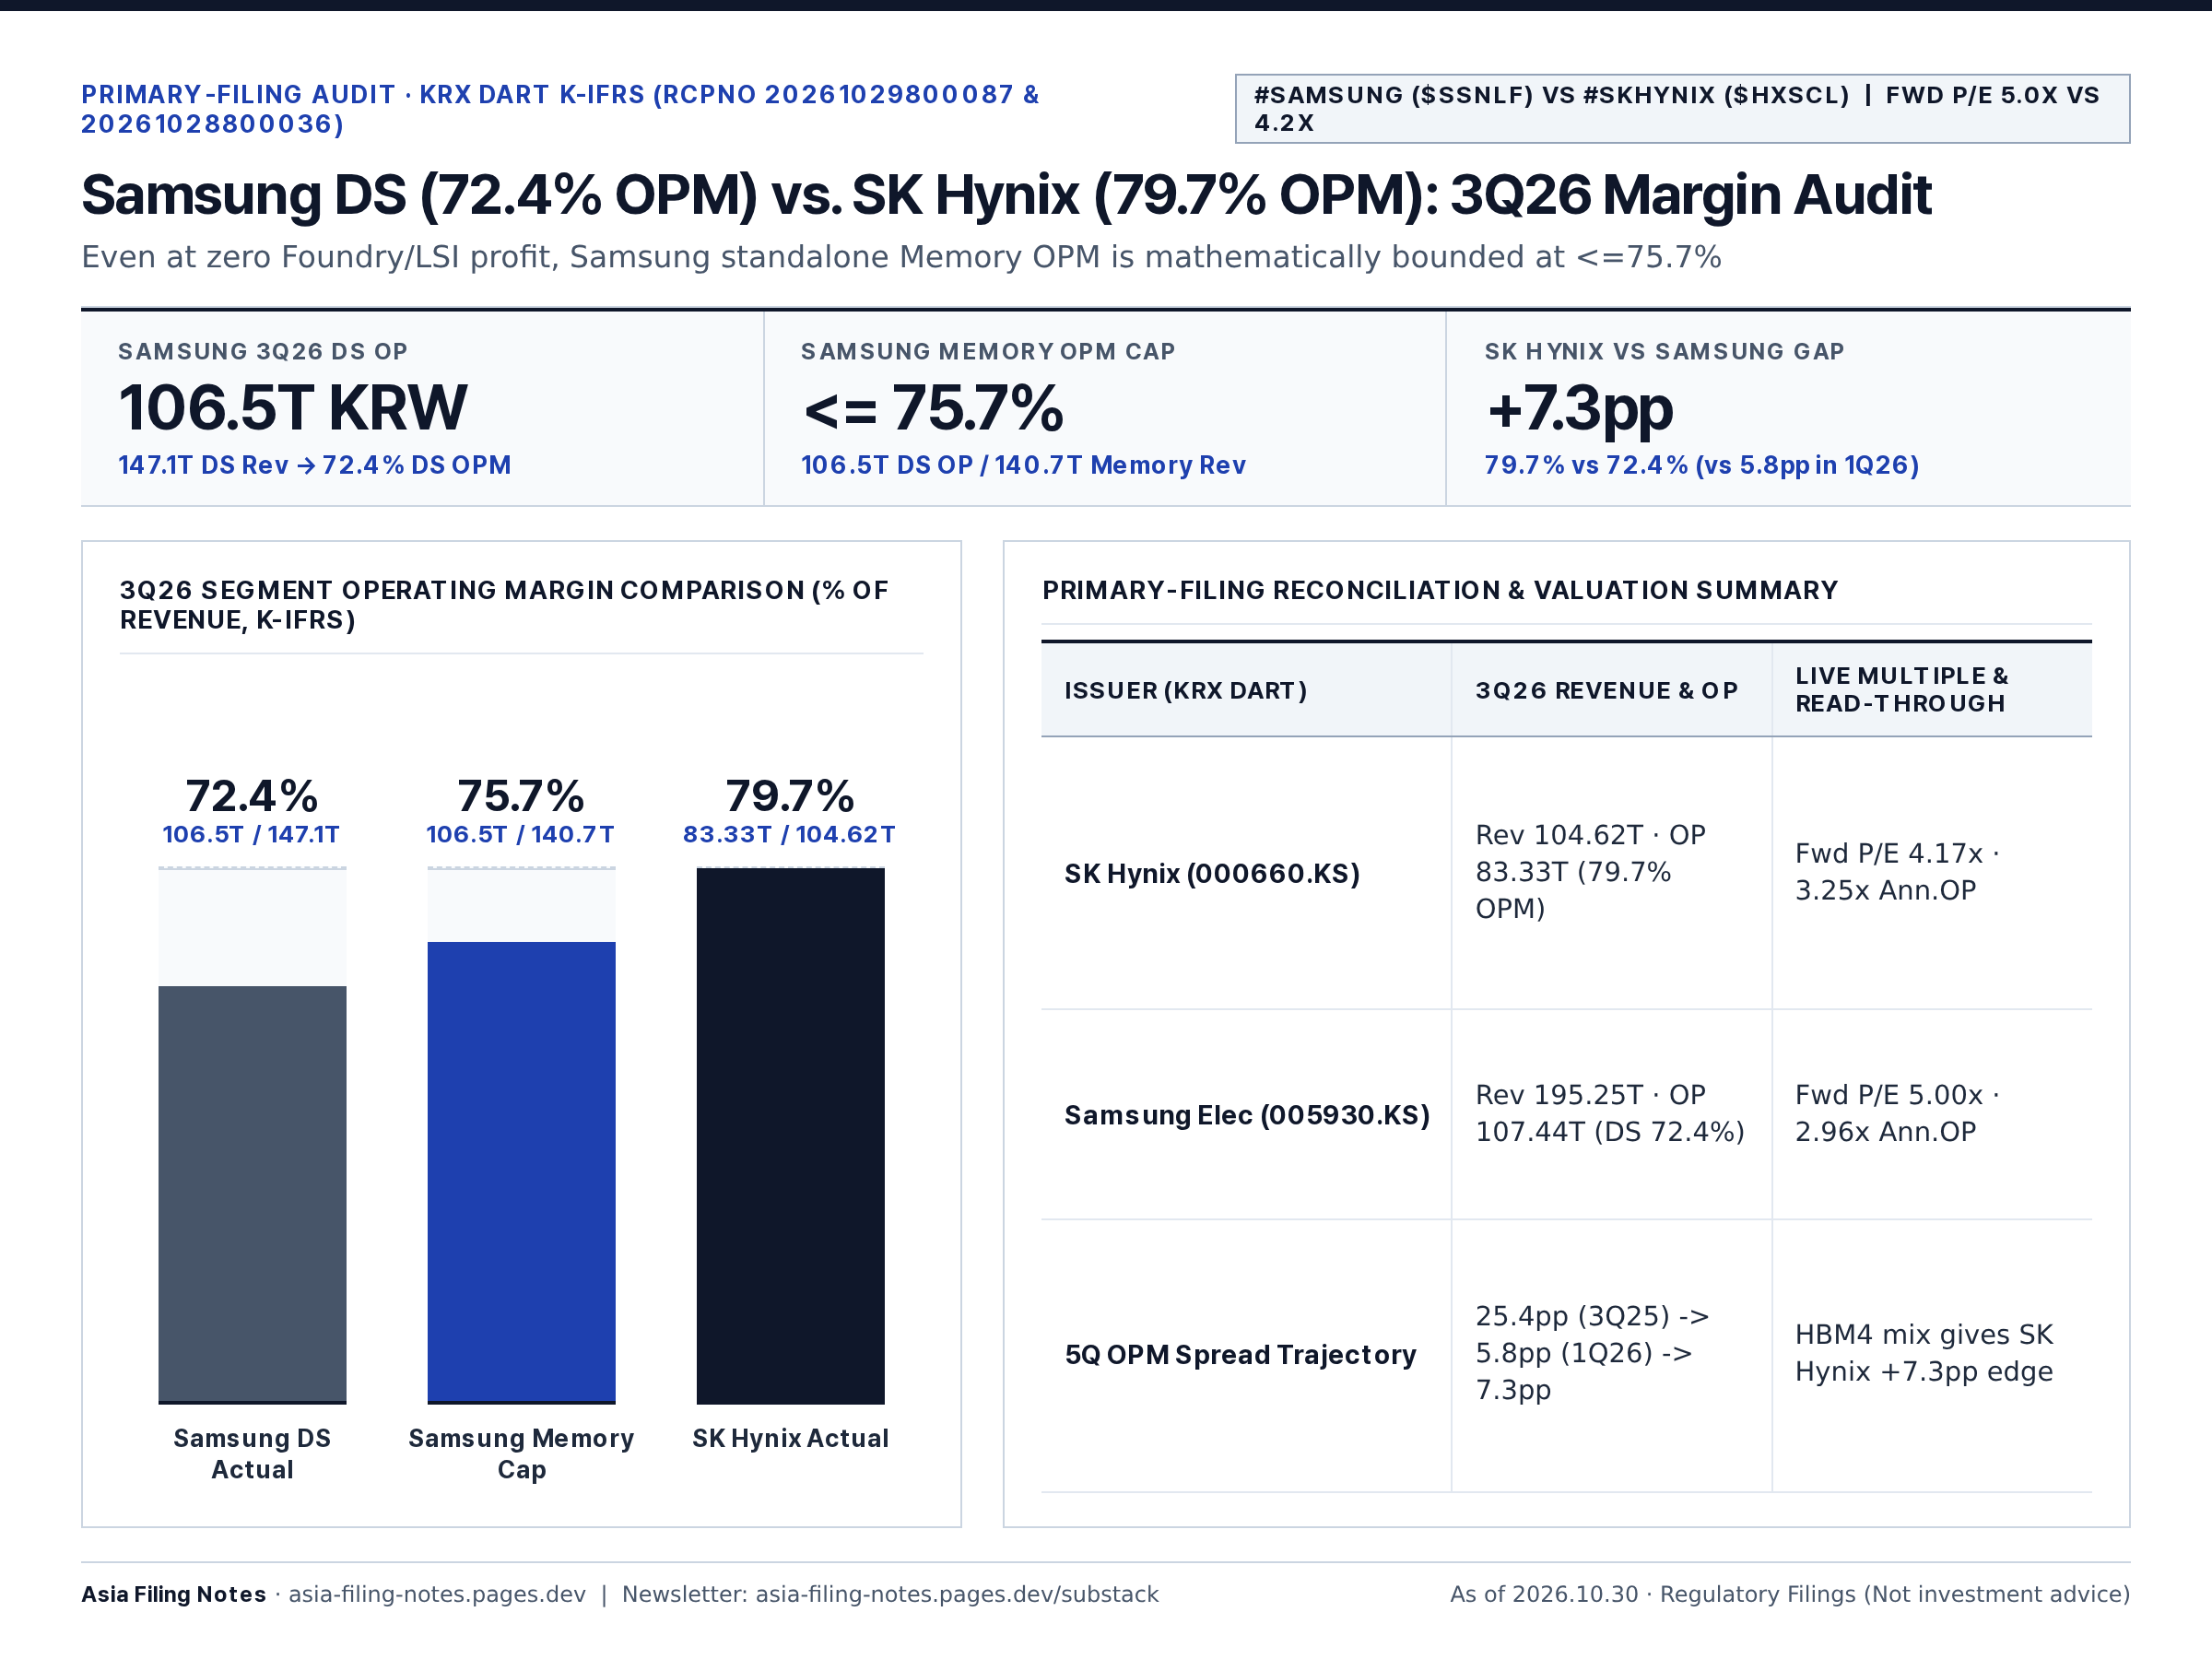
Trading at just 2.96x annualized 3Q OP (5.00x Fwd P/E); non-memory drag already priced in
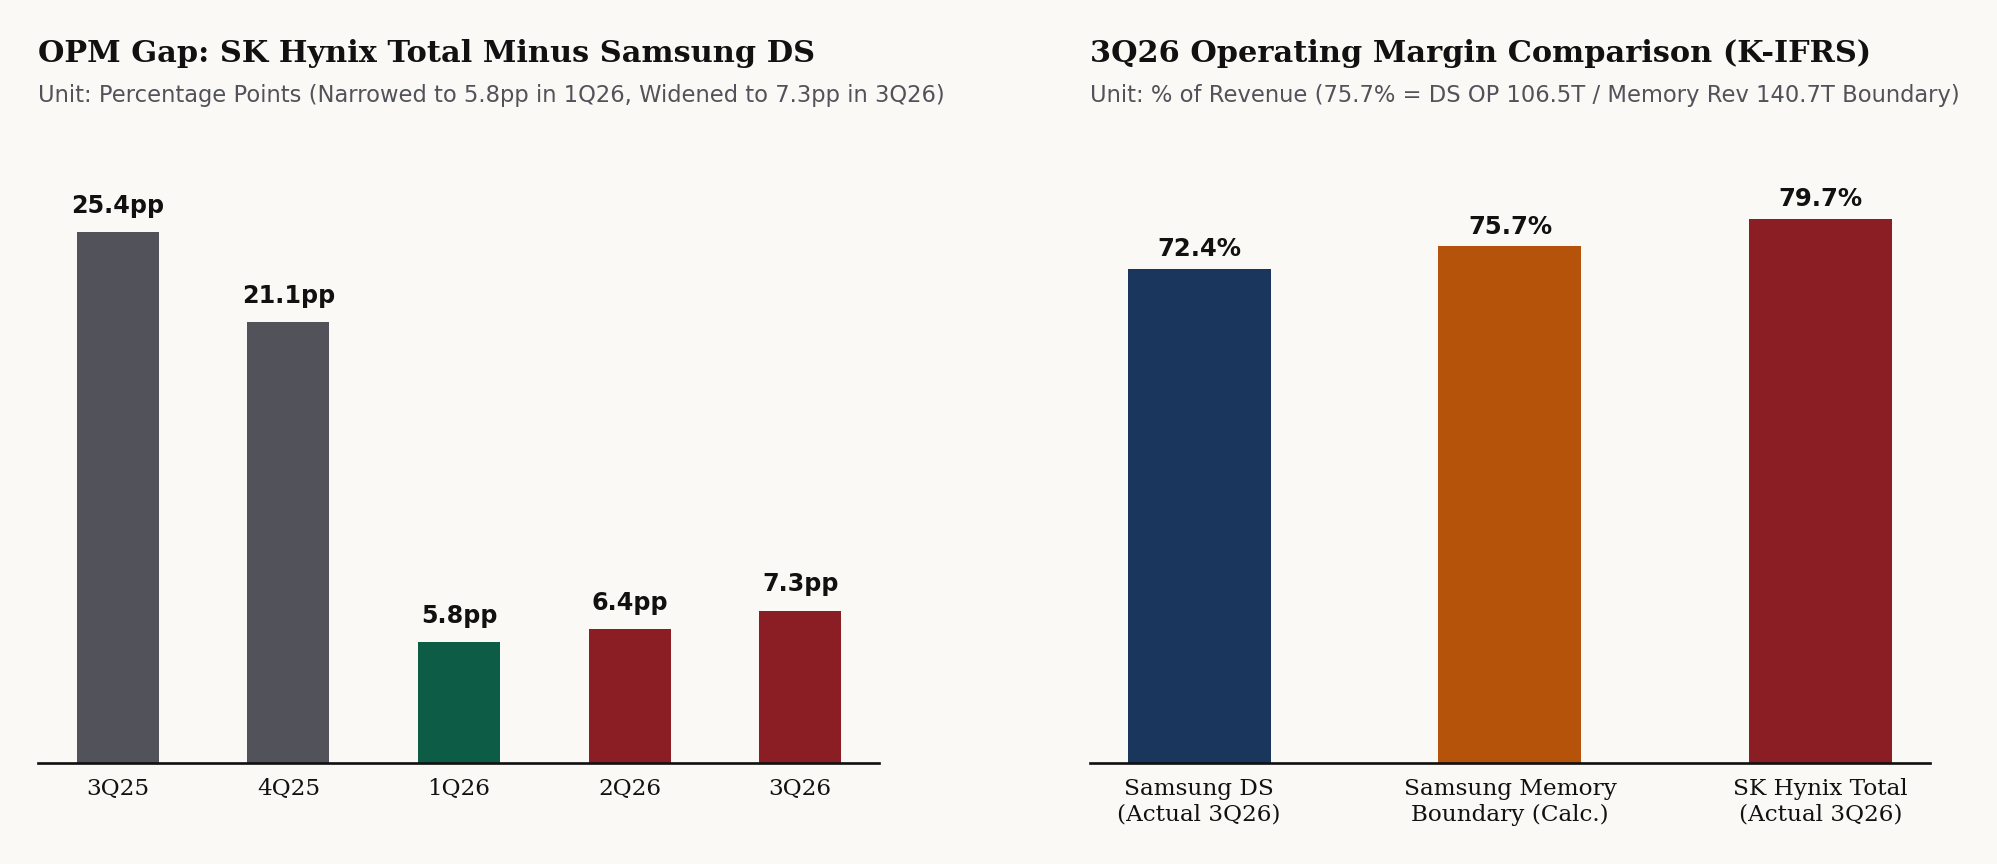
SK Hynix consolidated OPM (79.7%) vs. Samsung DS OPM (72.4%): the gap compressed from 25.4pp (3Q25) to 5.8pp (1Q26), then re-widened for two quarters to 7.3pp in 3Q26.
As of 2026.10.30 · Source: Samsung Electronics & SK Hynix DART Fair Disclosures & 3Q26 IR Decks · Derived ratios marked (Calc.).
1. 3Q26 DS Division vs. Standalone Memory Boundary (75.7%)
Reporting Scope Difference: Both companies report on a K-IFRS consolidated basis for July 1–September 30, 2026 [1][2][7]. Samsung discloses standalone Memory revenue (140.7T KRW) but reports operating profit only at the broader DS division level (Memory + System LSI + Foundry) [3], whereas SK Hynix's consolidated print includes NAND subsidiary Solidigm [7].
HBM4 & Base-Die Accounting Nuance: Server demand lifted memory prices across applications and HBM4 sales expanded sharply [4]. Foundry revenue/profit also improved on HBM base-die logic sales and leading-edge orders [4] → HBM base-die revenue sits inside Foundry (external vs. inter-segment split undisclosed), while FX was sequentially unfavorable for components [5].
Samsung facility CapEx 29.0T KRW (FY26 plan 84.4T, 9M 56.9T, implied 4Q ~27.5T); Cash PP&E: Samsung 26.9T KRW vs. SK Hynix 12.67T KRW
2. SK Hynix vs. Samsung DS: 5-Quarter Margin Trajectory
Left: 5-quarter operating margin gap (SK Hynix consolidated OPM minus Samsung DS OPM, in percentage points). Right: 3Q26 operating margin comparison showing Samsung DS (72.4%), the mathematical boundary for Samsung Memory if non-memory DS is non-negative (75.7%, Calc.), and SK Hynix consolidated (79.7%). Source: Samsung 4Q25–3Q26 IR decks & SK Hynix DART filings [3][7][10][11][13].
Mathematical Boundary for Standalone Memory OPM: SK Hynix 3Q26 unrounded DART OPM = 79.7% (80% in IR deck) [7][8]. Dividing Samsung DS OP (106.5T KRW) by standalone Memory revenue (140.7T KRW) gives 75.7% (Calc.) [3].
• If System LSI + Foundry OP ≥ 0 => Samsung Memory OPM ≤ 75.7% (still below SK Hynix's 79.7%).
• If System LSI + Foundry OP < 0 => Samsung Memory OPM > 75.7% (narrowing the true memory gap).
3. Facility CapEx Plan vs. Cash Flow Statement PP&E Outlays
Samsung 4Q26 Implied Facility Investment: 3Q26 facility investment was 29.0T KRW[4] against the 2026 annual plan of 84.4T KRW[6]. Subtracting 9M26 cumulative investment (56.9T KRW) leaves 84.4T - 56.9T = ~27.5T KRW implied for 4Q26 [4][6].
Cash PP&E Outflow Comparison (3Q26 Cash Flow Statement):Samsung 26.9T KRW vs. SK Hynix 12.67T KRW[3][8]. Both project AI memory demand to exceed supply into 2027 (Samsung guiding double-digit Foundry QoQ growth in 4Q26; SK Hynix guiding higher 2027 CapEx) [4][8].
Takeaway & Next-Quarter Checks
Hypothesis 1 (HBM Share vs. Commodity DRAM): Currently untestable from public filings because HBM revenue share, standalone Memory OP, and Foundry base-die inter-segment eliminations are undisclosed [3][4][8].
Hypothesis 2 (Does Rising DRAM Pricing Compress the Gap?): Across the 4 rising-price quarters (4Q25 [11], 1Q26 [12], 2Q26 [9][10], 3Q26 [4]), the gap narrowed twice (4Q25, 1Q26) and widened twice (2Q26, 3Q26) → mixed (2-for-2); check whether 4Q26 narrows below 7.3pp.
Personal analysis record based on public regulatory filings. Not investment advice or a solicitation to buy or sell any security.
Explore the Full Interactive Filing Audit & Peer Scorecard
Read the complete interactive edition—including live valuation gauges, downloadable K-IFRS / SEC Form 10-Q reconciliation tables, and direct DART receipt (rcpNo) & EDGAR links—on our primary research portal: