Why Global Investors Are Watching Korea's Primary K-IFRS Filings (SK Hynix, Samsung Electronics) Under a 4.90% US 10Y Yield Regime
Cross-checking DART primary financial statements against USD/KRW (1,340.7), PHLX Semiconductor (10,300.95), and Asia's industrial policy vectors.
Act I — The Macro, FX & Policy Backdrop
Global equity markets are navigating a high-dispersion regime: with the KOSPI at 5,683.80, the PHLX Semiconductor Index (SOX) at 10,300.95, USD/KRW at 1,340.73, and the U.S. 10-Year Treasury Yield at 4.90%, top-down index beta masks violent rotation underneath the surface.
- Cross-Market Sector Dispersion: KRX resilience (KOSPI +0.62%) despite US semiconductor volatility (SOX -11.84%) highlights rotation toward upstream Korean suppliers printing hard 3Q26 operating profit
- FX Translation Vector: Constructive USD/KRW (1,340.7) equilibrium supporting K-IFRS export operating margins while stabilizing foreign institutional FX flows
- Discount-Rate Discipline: Higher-for-longer US 10Y yield (4.90%) penalizing long-duration narratives and rewarding verified K-IFRS operating cash flow & sub-1.0x P/B balance sheets
- US BIS HBM/Advanced-Node Export Controls, CHIPS Act Guardrails & K-Chips Tax Credits: Tightening US BIS export controls on high-bandwidth memory and advanced packaging tools—alongside Korea's National Strategic Technology tax-credit extensions (K-Chips Act)—are concentrating capital expenditure into domestic HBM/testing leaders while compressing legacy commodity-wafer suppliers.
- Fed–BOK Monetary Policy Divergence & US Trade/Tariff (IEEPA) Transmission: With the Federal Reserve maintaining real-rate discipline and the Bank of Korea constrained by FX stability and domestic debt ratios, equity dispersion favors a barbell between dollar-invoicing AI/grid exporters and deeply discounted KRX balance-sheet compounders.
Act II — Primary K-IFRS Filing Evidence (FSS OpenDART)
1. SK Hynix (KRX: 000660) — UNDERVALUED
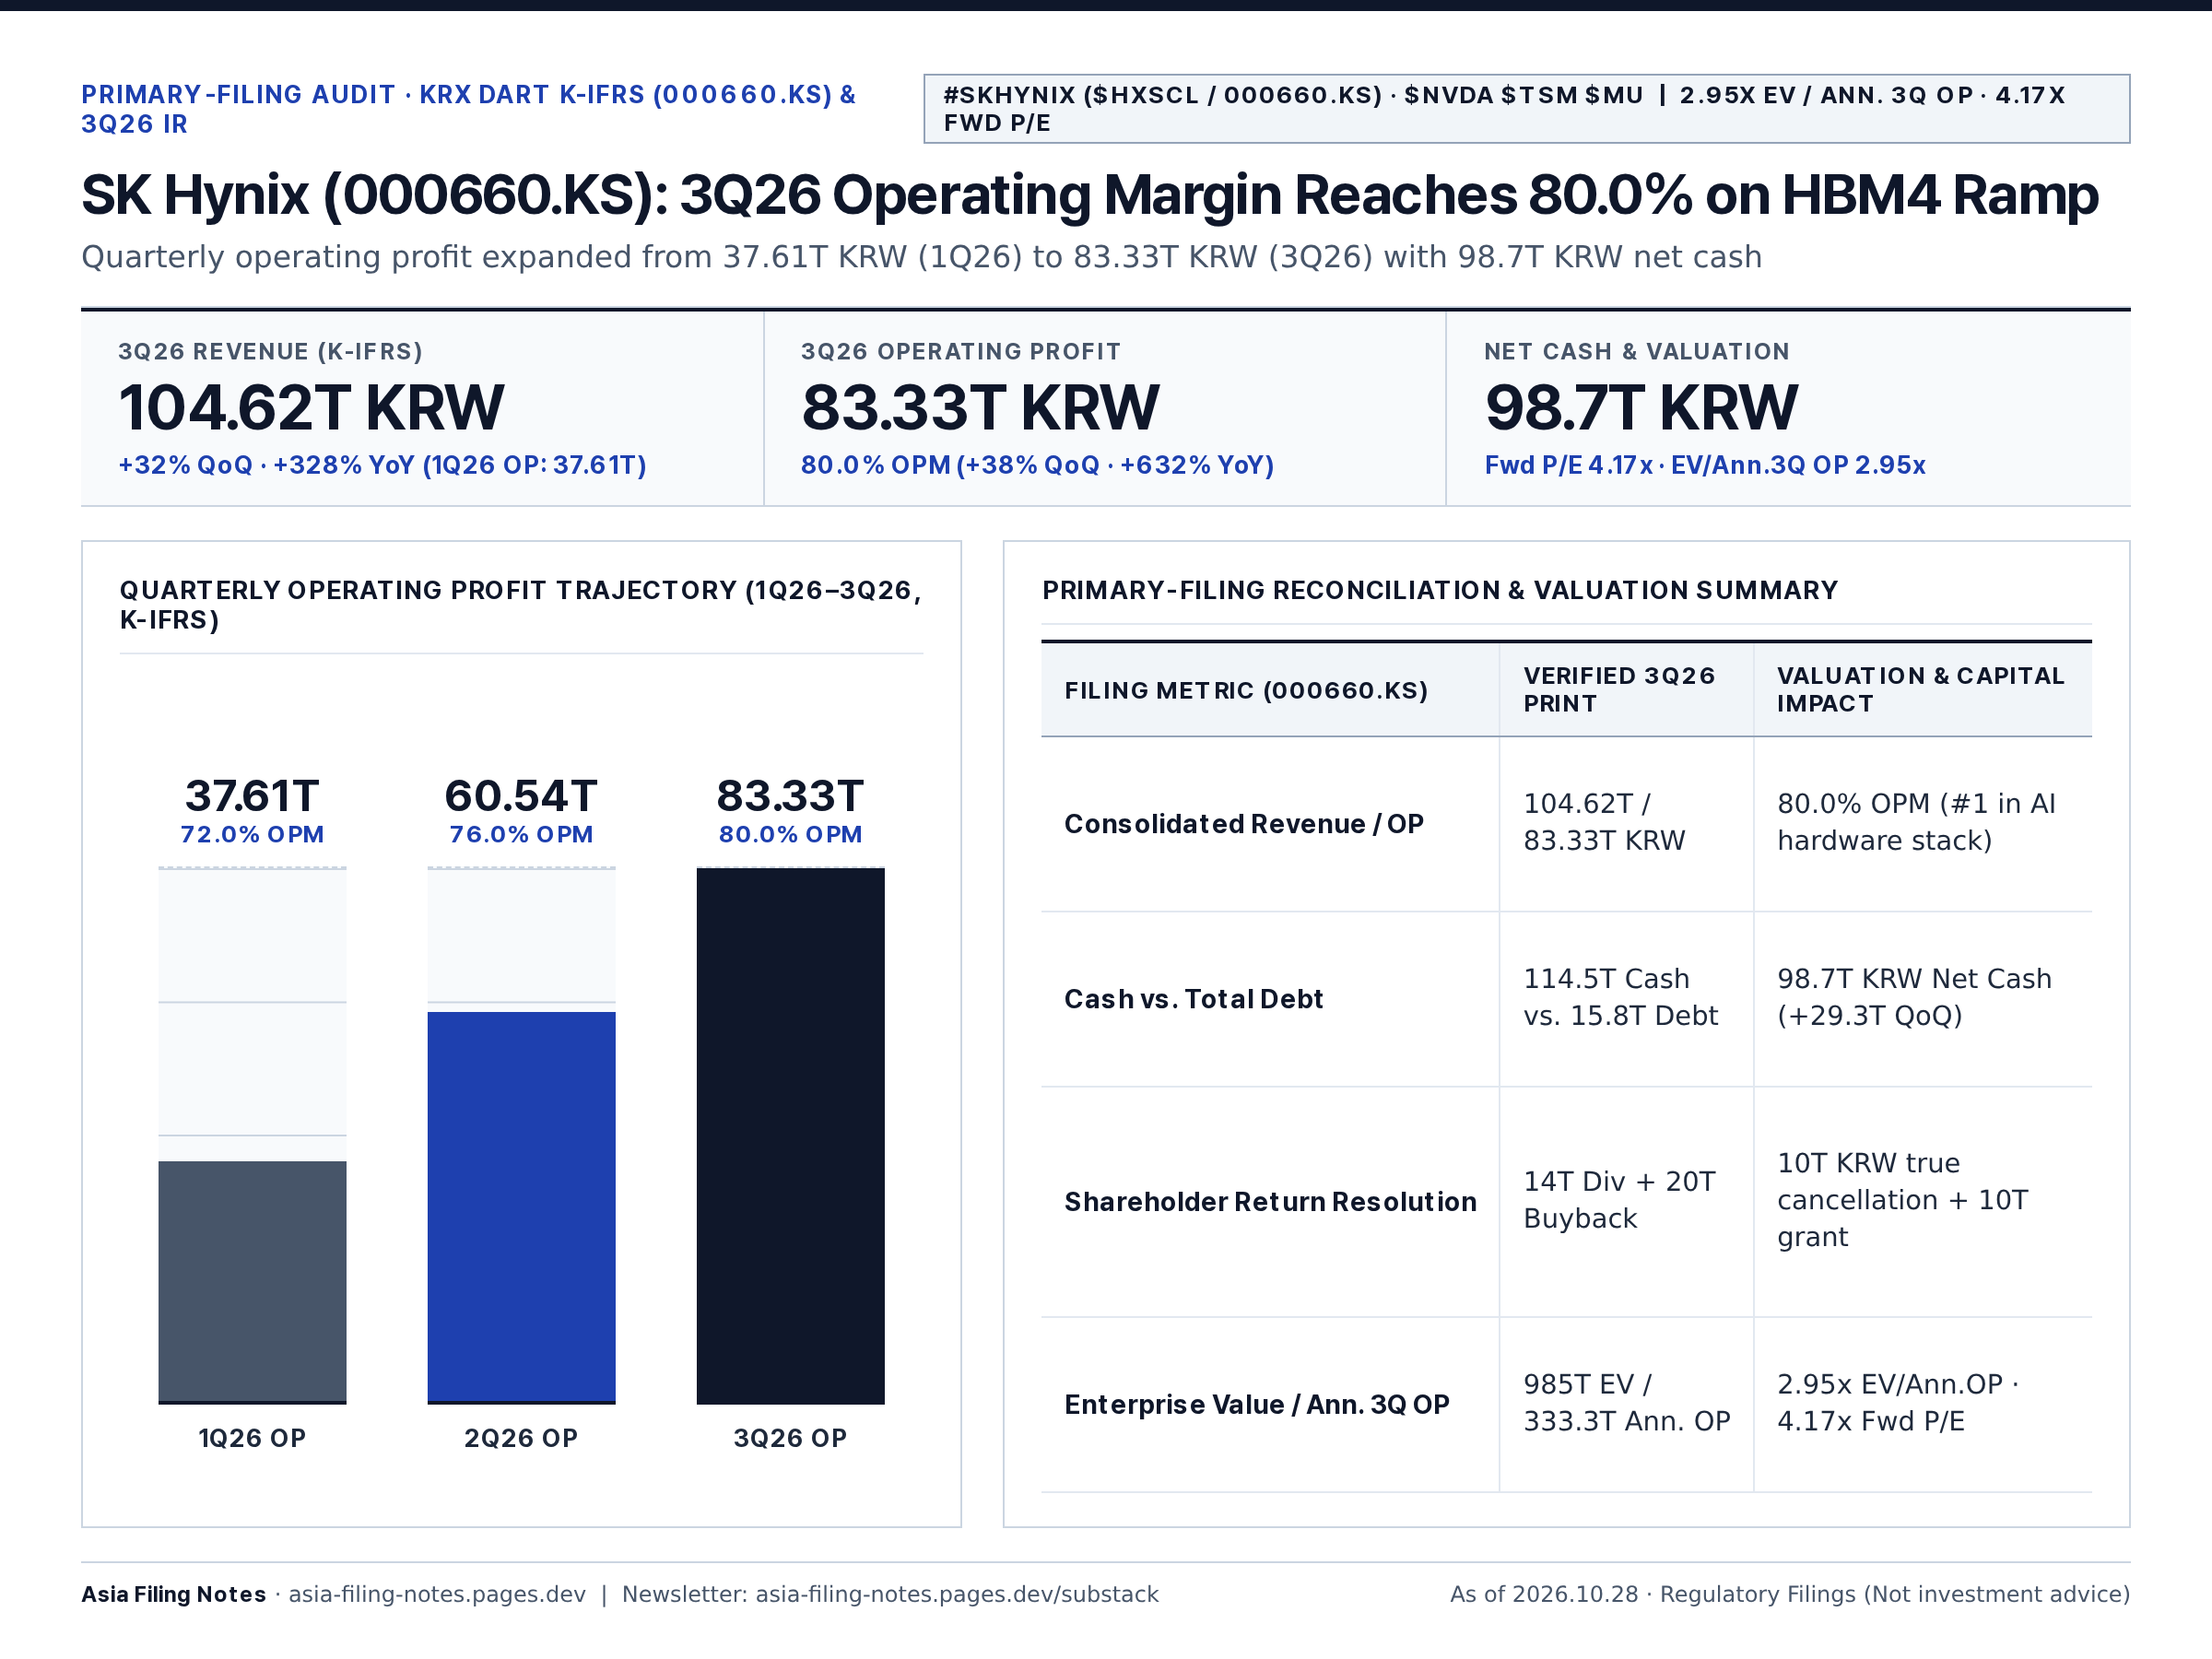
In its latest primary DART filing (연결재무제표기준영업(잠정)실적(공정공시), Receipt No. 20261029800112),
SK Hynix reported revenue of 17,573.0B KRW (~$13,107.0M USD) and operating profit of
7,030.0B KRW (+292.3% YoY), translating into a verified K-IFRS operating margin of 40.10%.
Valuation & Multiples Snapshot: Market Cap: 158,704.0B KRW | P/Ann.OP: 5.6x | P/B: 2.15x | P/E: 7.80x | Global Peer Benchmark: $NVDA $TSM $MU
Macro & Policy Read-Through: Reported preliminary operating profit of 7,030.0B KRW (QoQ +28.6%, YoY +292.3% (40.10% OPM)), placing the 158,704B KRW market cap at 5.6x annualized OP and 2.15x P/B. Key catalyst is confirming non-operating FX/finance spreads in the full quarterly footnotes. Against a 1,340.7 USD/KRW exchange rate and a 4.90% US 10-year Treasury yield, investors are pricing the spread between realized operating cash flow and tangible book value.
2. Samsung Electronics (KRX: 005930) — UNDERVALUED
In its latest primary DART filing (연결재무제표기준영업(잠정)실적(공정공시), Receipt No. 20261031800105),
Samsung Electronics reported revenue of 79,098.0B KRW (~$58,996.2M USD) and operating profit of
9,183.4B KRW (+277.4% YoY), translating into a verified K-IFRS operating margin of 11.60%.
Valuation & Multiples Snapshot: Market Cap: 353,411.0B KRW | P/Ann.OP: 9.6x | P/B: 1.05x | P/E: 10.40x | Global Peer Benchmark: $NVDA $TSM $MU
Macro & Policy Read-Through: Reported preliminary operating profit of 9,183.4B KRW (QoQ -12.1%, YoY +277.4% (11.60% OPM)), placing the 353,411B KRW market cap at 9.6x annualized OP and 1.05x P/B. Key catalyst is confirming non-operating FX/finance spreads in the full quarterly footnotes. Against a 1,340.7 USD/KRW exchange rate and a 4.90% US 10-year Treasury yield, investors are pricing the spread between realized operating cash flow and tangible book value.
Act III — Cross-Market Takeaway & Primary Filing Portal
When evaluating Asian semiconductor, grid hardware, and deep-value industrial names alongside U.S. benchmarks, primary K-IFRS footnote discipline separates structural margin expansion from one-off FX or accounting noise.
Originally published at https://asia-filing-notes.pages.dev/posts/sk-hynix-3q26-earnings-hbm4-80pct-opm-audit/ (Asia Filing Notes). Personal analysis record based on public regulatory filings and market data. Not investment advice or a solicitation to buy or sell any security.