KRX: 000660 · DART K-IFRS & IR
Korea & Asia Primary Filings · Semiconductors & HBM
·
Published 2026-10-29 (4 min read)
SK Hynix 3Q26 Audit: 104.62T KRW Revenue, 80% OPM, HBM4 Crossover & ~100T KRW Shareholder Return Plan
SO WHAT? · VALUATION ESTIMATE & 6–12M DIRECTION
Ex-Net Cash (98.7T KRW), Enterprise Value (985T KRW) Is Just 2.95x Annualized 3Q26 Operating Profit (Fwd P/E 4.17x)
✓ Multi-Agent 3-Round Verified
UNDERVALUED
▲ BULLISH (98.7T Net Cash + 22.4T Return)
● UNDERVALUED
● FAIR VALUE
● OVERVALUED
STEP 1 · 3Q26 FILING FACT
104.6T KRW Rev, 83.4T OP (80% OPM), +47.3T FCF (Net income dip driven by -32.6T non-op swing)
→
STEP 2 · VALUATION ESTIMATE
Trailing P/E 6.61x · Consensus Fwd P/E 4.17x · EV / Annualized 3Q OP 2.95x
→
STEP 3 · 6–12M DIRECTION
▲ BULLISH — 22.4T KRW capital return (10T cancellation + 12.4T dividend) + HBM4 lock in floor
| Issuer & Live Multiples | Valuation Estimate | 6–12M Direction | So What? (Valuation Basis & Catalyst) |
|---|---|---|---|
| SK Hynix (000660.KS) 1,391,000 KRW · Fwd P/E 4.17x · EV/Ann.3Q OP 2.95x | UNDERVALUED | ▲ Strong Bullish | 17.5% annualized 3Q FCF yield and 4.17x Fwd P/E represent deep structural undervaluation |
104.6155T KRW quarterly revenue (+328% YoY), 80% operating margin (83.3338T KRW OP), 98.7T KRW net cash, and a ~100T KRW FY26 shareholder return target landed in a single release.
As of 2026.10.28 · Source: SK Hynix 3Q26 Business Results (2026.10.28) · Derived ratios marked (Calc.).
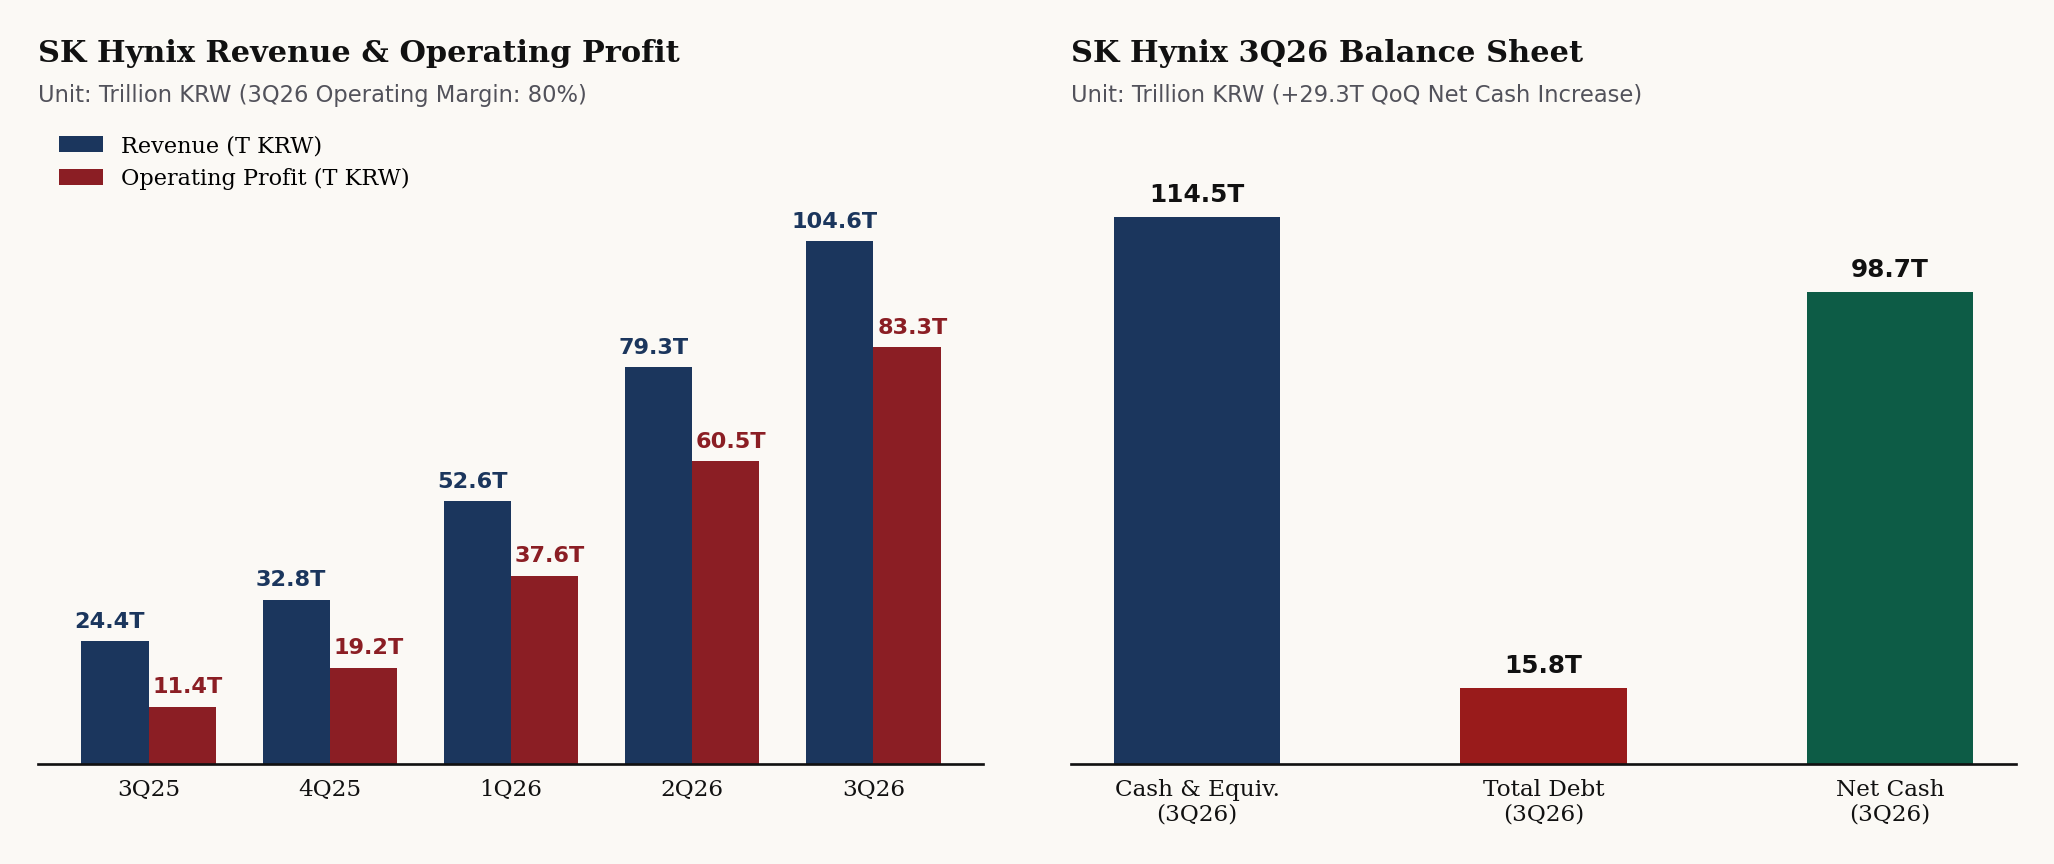
Left: SK Hynix quarterly revenue and operating profit progression (3Q25–3Q26). Right: Balance-sheet cash vs. borrowings and net cash expansion. Source: SK Hynix quarterly releases [1][3][4].
1. 3Q26 Earnings Scorecard: 80% OPM vs. -58% QoQ Net Profit Drop
- Revenue Doubled in 6 Months: 3Q26 revenue 104.6155T KRW (+32% QoQ vs. 79.3187T in 2Q26; +328% YoY vs. 24.4489T in 3Q25; 2x 1Q26's 52.5763T KRW) [1][2][3][4].
- Operating Leverage: OP hit 83.3338T KRW (+38% QoQ vs. 60.5426T; +632% YoY vs. 11.3834T) → OPM 80% (+33pp YoY; +3.33pp unrounded QoQ, Calc.) [1][3][4].
- Operating vs. Net Profit Divergence: Net profit was 39.7756T KRW (38% net margin; +216% YoY vs. 12.5975T, but -58% QoQ vs. 2Q26's 93.9226T KRW, where net profit exceeded 60.5426T OP due to non-operating items) [1][3].
| Item | 3Q26 Summary |
|---|---|
| Revenue | 104.6155 trillion KRW, +32% QoQ |
| Operating Profit | 83.3338 trillion KRW, operating margin 80% |
| Net Profit | 39.7756 trillion KRW, +216% YoY, -58% QoQ |
| Product Mix | Management expects HBM4 revenue to overtake HBM3E in 4Q26 |
| Long-Term Agreements | Over 50% of total 2027–2028 production capacity already contracted |
| Balance Sheet | Cash & equivalents 114.5T KRW, borrowings 15.8T KRW, net cash 98.7T KRW |
| Net Cash Increase | +29.3 trillion KRW vs. end of 2Q26 (Calc.) |
| FY2026 Return Target | ~100T KRW (≥30T KRW cash dividends, ≥60T KRW share buybacks & cancellations) |
| 3Q26 Board Resolutions | 14T KRW dividend (20,000 KRW/share), 20T KRW buyback (only the 10T KRW cancellation tranche counts toward the return total) |
2. HBM4 4Q26 Crossover & 2027–2028 LTA Structure
- HBM4 Overtakes HBM3E in 4Q26: Following 2Q26 mass shipments, Cheongju M15X capacity is being maximized so HBM4 overtakes HBM3E in both volume and revenue in 4Q26, alongside surging high-density server DDR5 and 321-layer TLC eSSD sales [1][2].
- >50% of 2027–2028 Capacity Locked Under LTAs: Global cloud LTAs cover >50% of 2027–2028 capacity with market-linked price bands (locking volume, not fixed margins); management projects demand > supply through 2030 [1]. Solidigm IPO review was halted [1].
3. Balance Sheet (98.7T KRW Net Cash) & ~100T KRW Shareholder Return Breakdown
- Net Cash Surge Ahead of 2027 Yongin Phase 1 CapEx: Cash rose +26.5T KRW QoQ (88.0T → 114.5T KRW) while borrowings fell -2.8T KRW QoQ (18.6T → 15.8T KRW) →
Net Cash = 114.5T - 15.8T = 98.7T KRW (+29.3T KRW QoQ, Calc.)[1]. - FY26 Shareholder Return (~100T KRW Target = ≥50% of FCF; ≥30T Dividends + ≥60T Buyback/Cancellation):
• Completed in Oct: 40T KRW buyback (announced Aug) completed and proceeding to cancellation [1].
• New 3Q26 Dividend Resolution (14T KRW / 20,000 KRW per share): 10,000 KRW base quarterly DPS + 10,000 KRW special DPS from Kioxia investment gains [1].
• New 3Q26 Buyback Resolution (20T KRW): Explicitly split into 10T KRW for full cancellation (counted in the ~100T return) + 10T KRW for employee compensation (excluded from shareholder return tally) [1].
| Quarter | Operating Margin (Company Release) |
|---|---|
| 3Q25 | 47% |
| 4Q25 | 58% |
| 1Q26 | 72% |
| 2Q26 | 76% |
| 3Q26 | 80% |
Takeaway & 4Q26 Checks
- 4Q26 Checklist: (1) Verify HBM4 > HBM3E revenue crossover and M15X yield stability; (2) Track LTA band ASPs; (3) Reconcile 2Q/3Q non-operating items and ending net cash after 14T dividend + 20T buyback + Yongin CapEx.
Sources
- SK Hynix 3Q26 Business Results Press Release (KR), 2026.10.28.
- SK hynix 3Q26 Financial Results Press Release (EN), 2026.10.28.
- SK Hynix 2Q26 Business Results Press Release (KR), 2026.07.29.
- SK Hynix 1Q26 Business Results Press Release (KR), 2026.04.23.
This note is a personal analysis record and is not investment advice or a solicitation to buy or sell any security. Investment decisions and responsibilities rest with the reader.
FREE EMAIL DISPATCH · SUBSTACK & DIRECT INBOX ALERTS
Get Primary Korean DART (K-IFRS) & Asia Semiconductor Filing Notes Before Secondary Wires
Receive direct email alerts whenever a new Korean FSS DART preliminary earnings note, treasury-share burn check, or U.S. SEC CapEx cross-check is published. 100% free, one-way analytical record.
Reader Discussion & Filing Notes (0)
Discuss K-IFRS footnotes, DART
rcpNodisclosures, KOSPI/KOSDAQ valuation gaps, or test the falsifiable hypotheses in this note. Free reader accounts take 10 seconds to create.