3Q26 Primary-Filing Charts & Visuals Gallery (Editorial Broadsheet Edition)
7 VERIFIED MULTI-PANEL CHARTS
All charts are generated directly from Korean FSS DART K-IFRS disclosures, TWSE releases, SEC XBRL tables, and Federal Reserve / U.S. Treasury data.
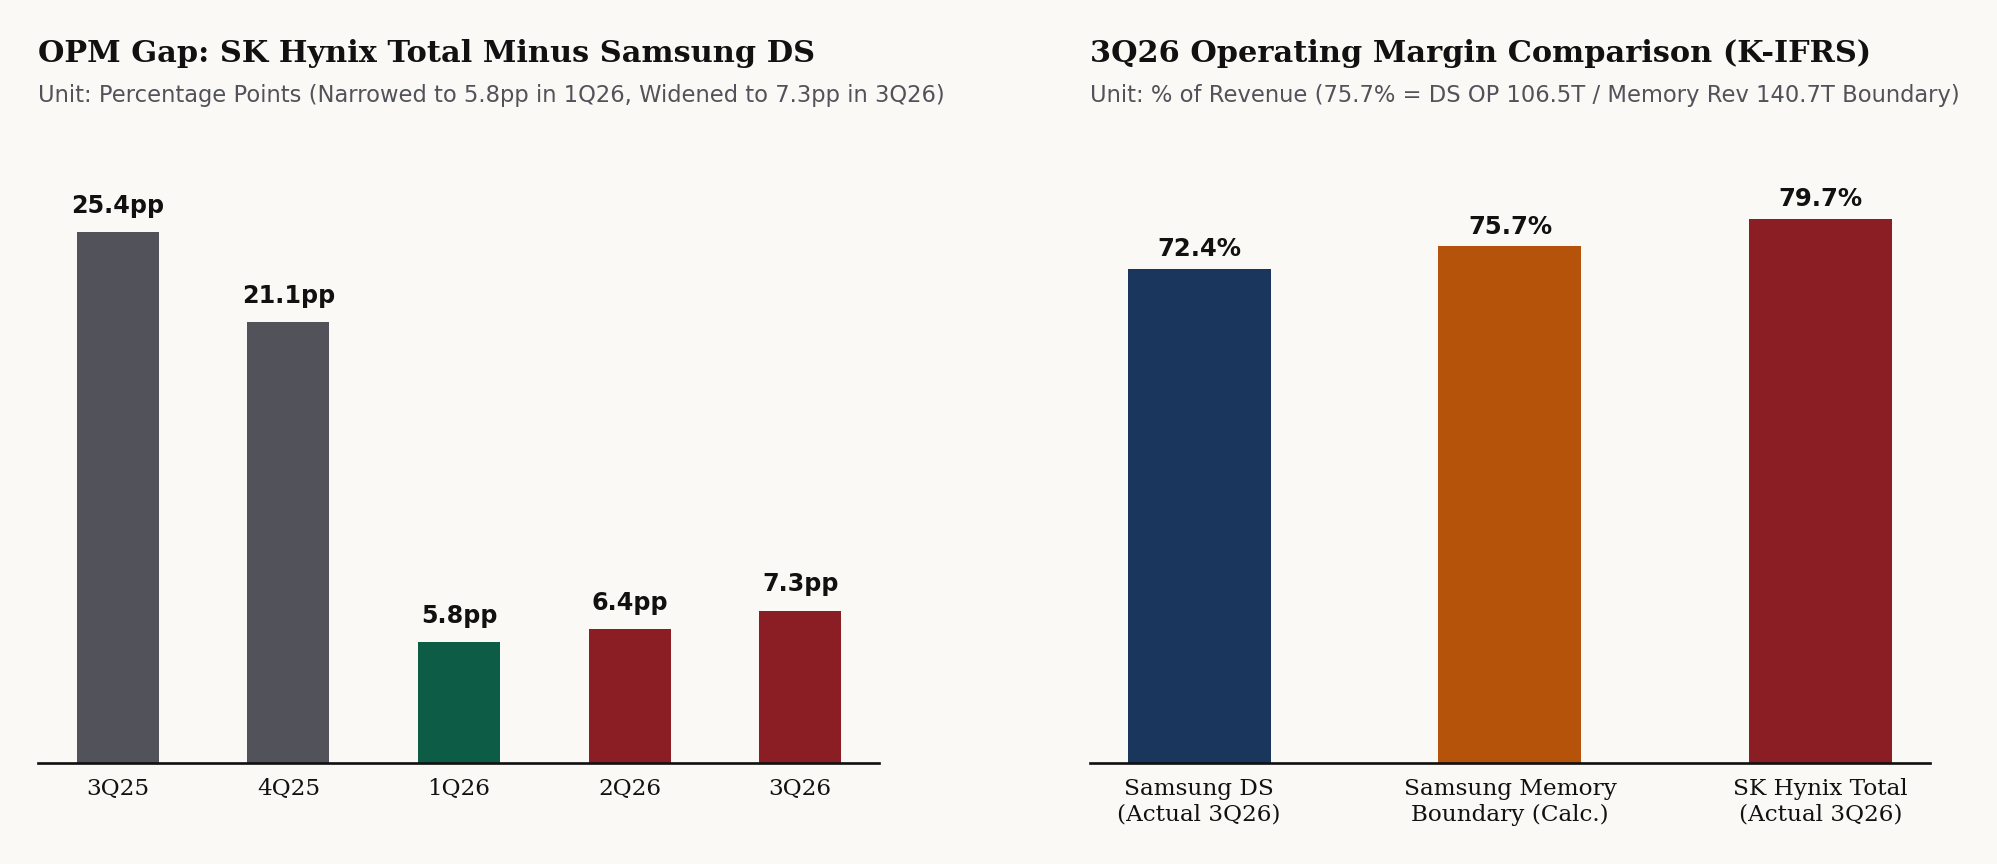
DART K-IFRS comparison of SK Hynix consolidated OPM vs. Samsung DS division OPM across 3Q25–3Q26 (gap moving 25.4pp -> 5.8pp -> 7.3pp) and the 75.7% mathematical boundary for Samsung Memory OPM.
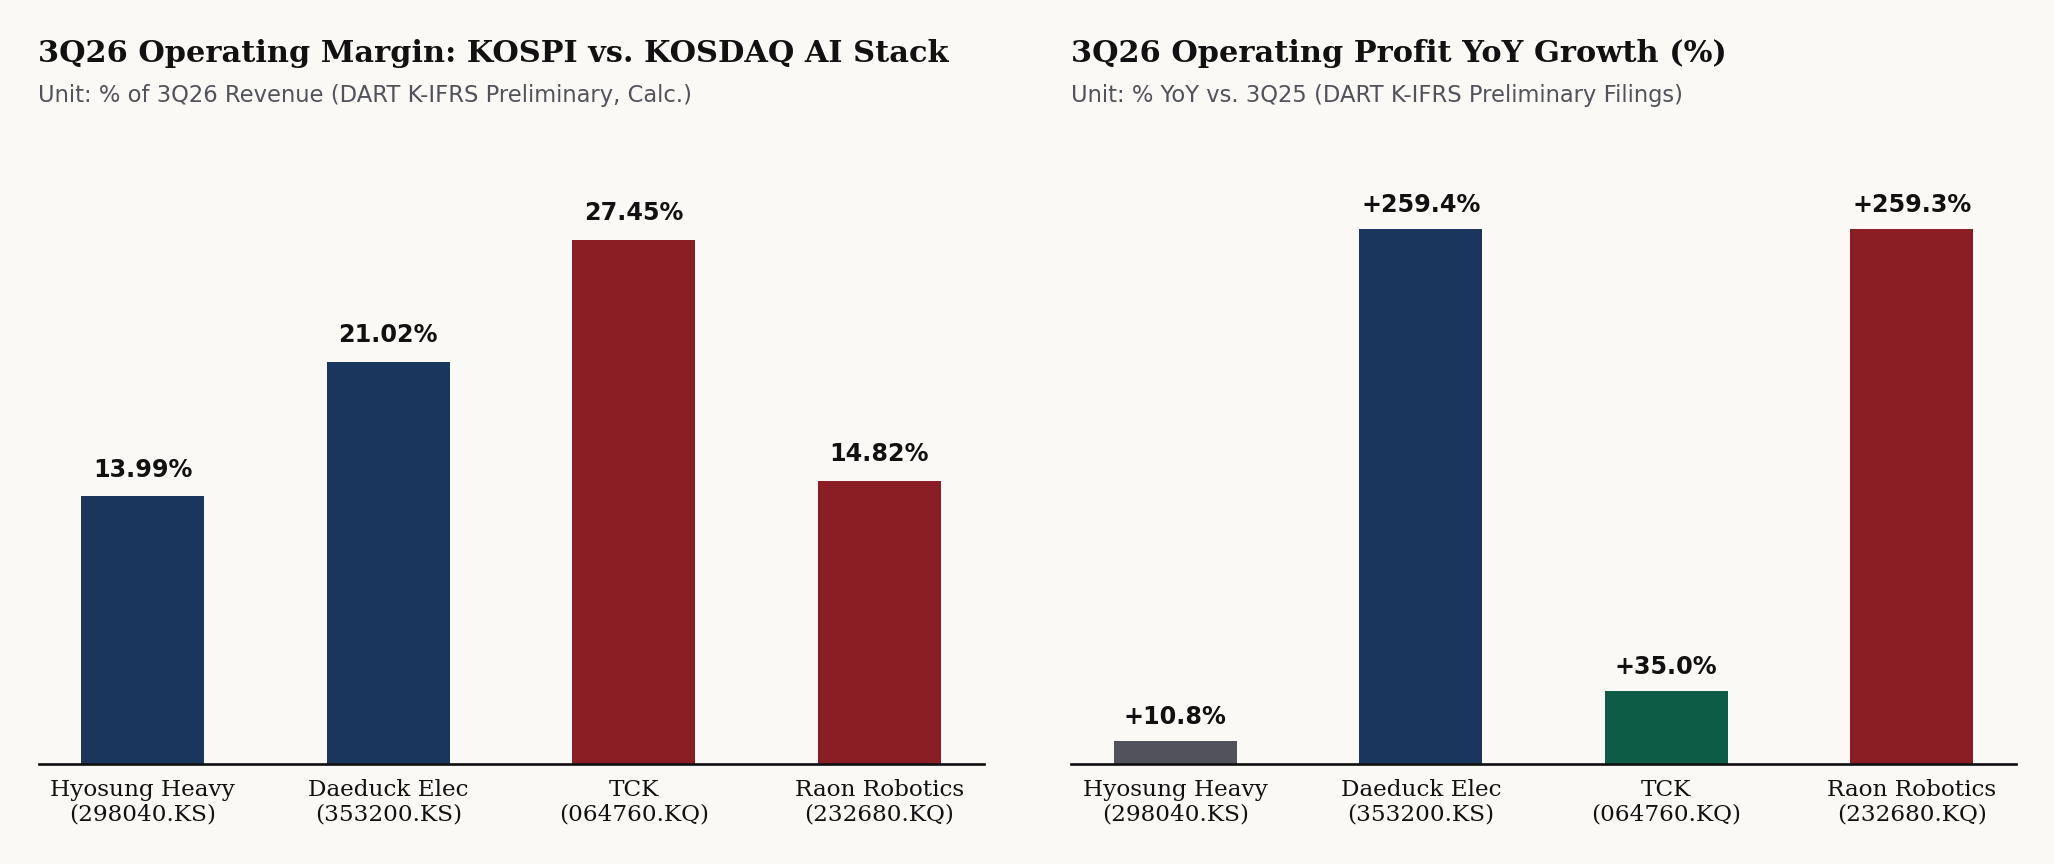
Comparing 3Q26 OPM and YoY operating profit growth across KOSPI (Hyosung Heavy 298040.KS 13.99% OPM, Daeduck Electronics 353200.KS 21.02% OPM / +259.4% YoY) and KOSDAQ (TCK 064760.KQ 27.45% OPM, Raon Robotics 232680.KQ 14.82% OPM / +259.3% YoY).
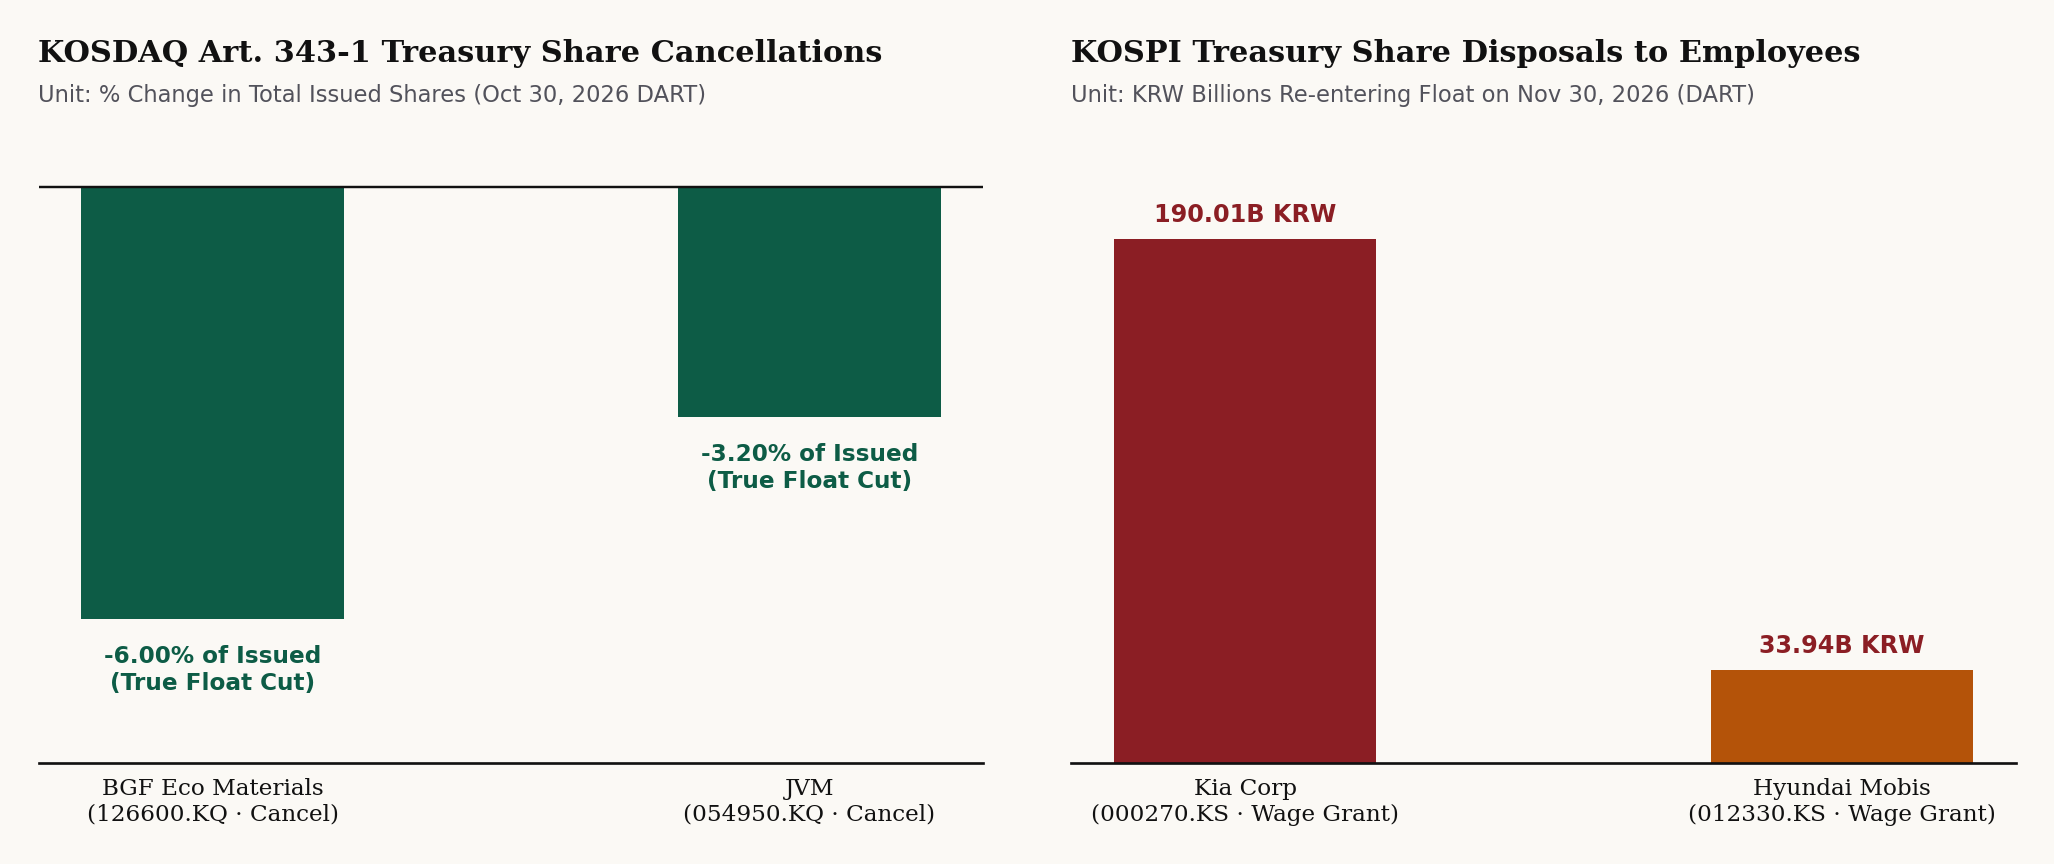
October 30, 2026 DART comparison of permanent share cancellations at BGF Eco Materials (126600.KQ, -6.00% of issued shares) and JVM (054950.KQ, -3.20%) vs. employee wage disposals at Kia (000270.KS, 190.01B KRW) and Hyundai Mobis (012330.KS, 33.94B KRW).
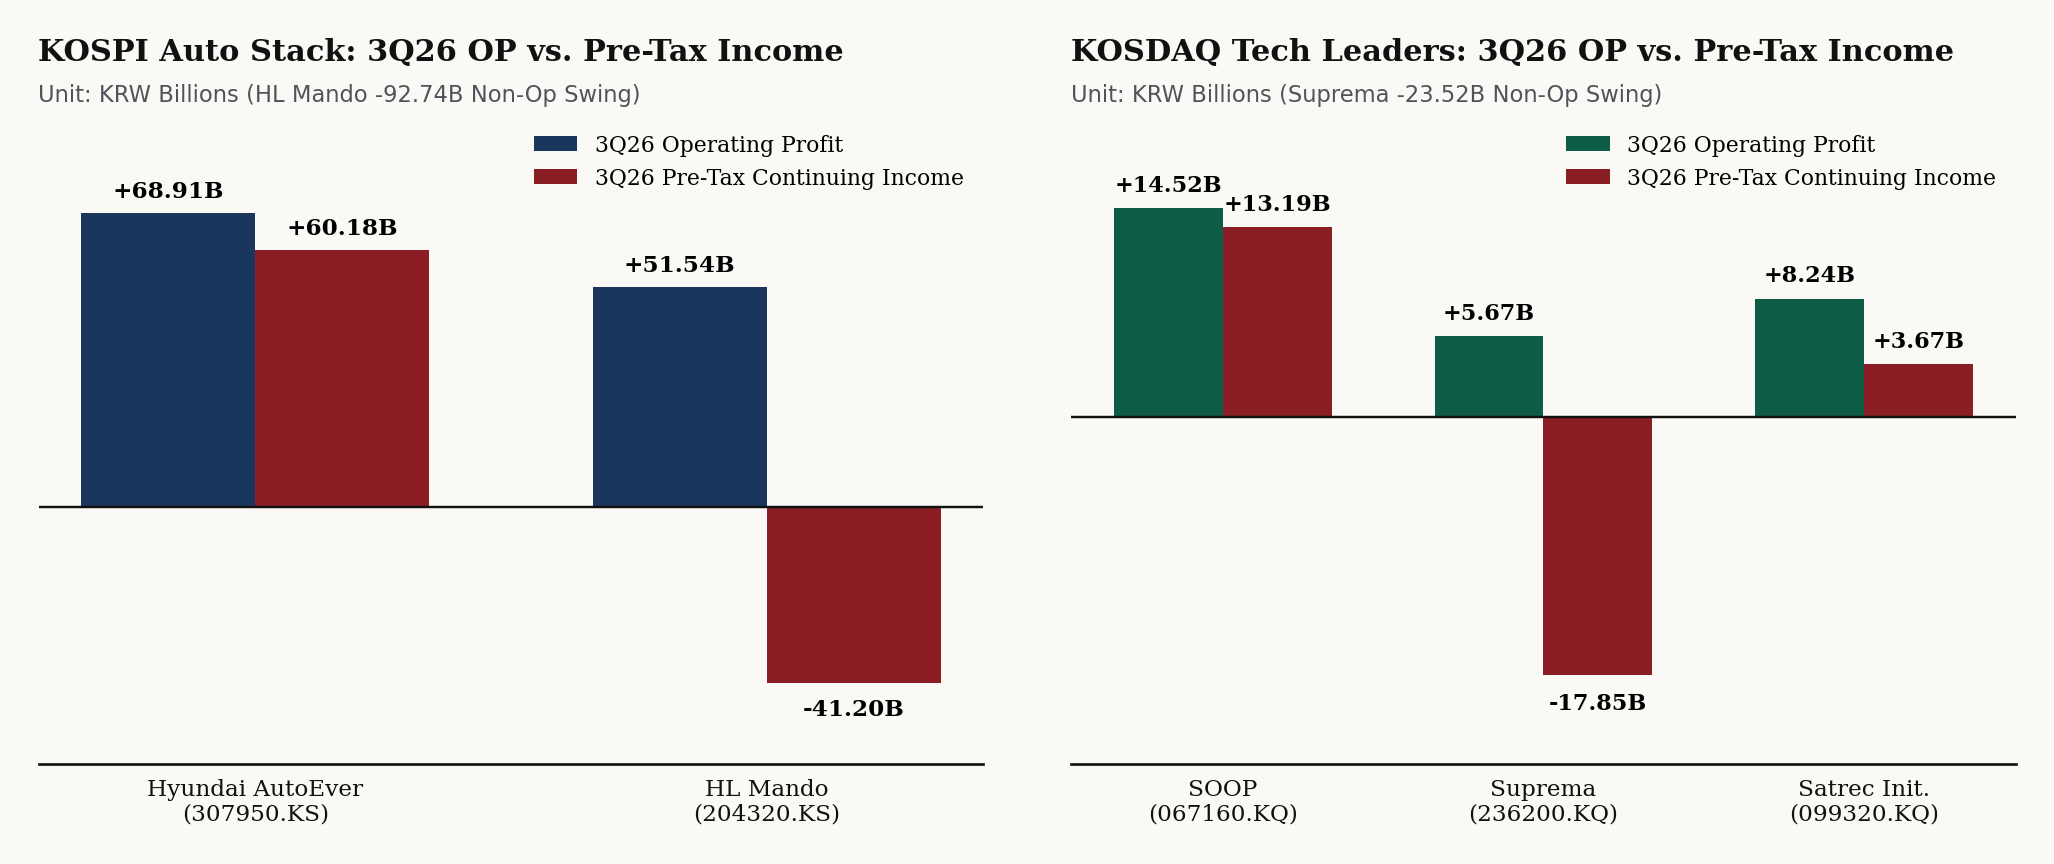
Why stopping at operating profit misleads in Korean preliminary filings: auditing the -92.74B KRW non-operating swing at HL Mando (204320.KS) and -23.52B KRW swing at Suprema (236200.KQ) alongside Satrec Initiative's (099320.KQ) +502.7% QoQ OP breakout.
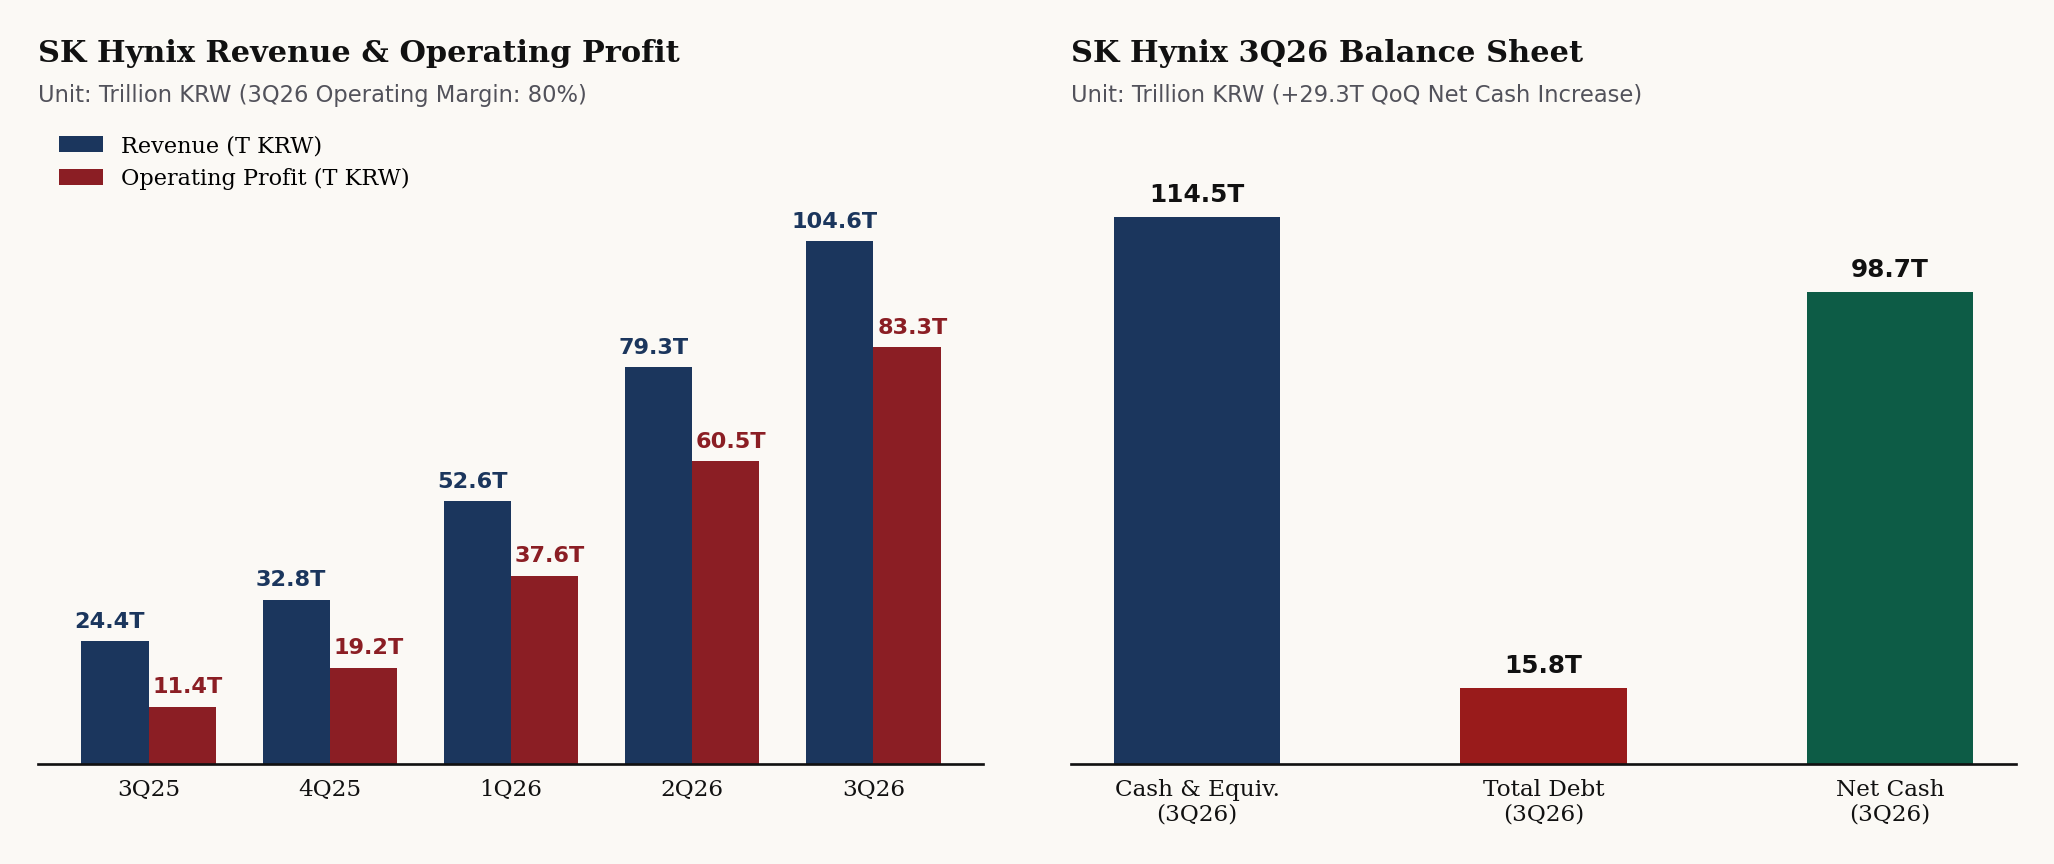
Five-quarter operating margin expansion (47% -> 80% on 104.62T KRW revenue) and balance-sheet net cash rising +29.3T KRW QoQ to 98.7T KRW.
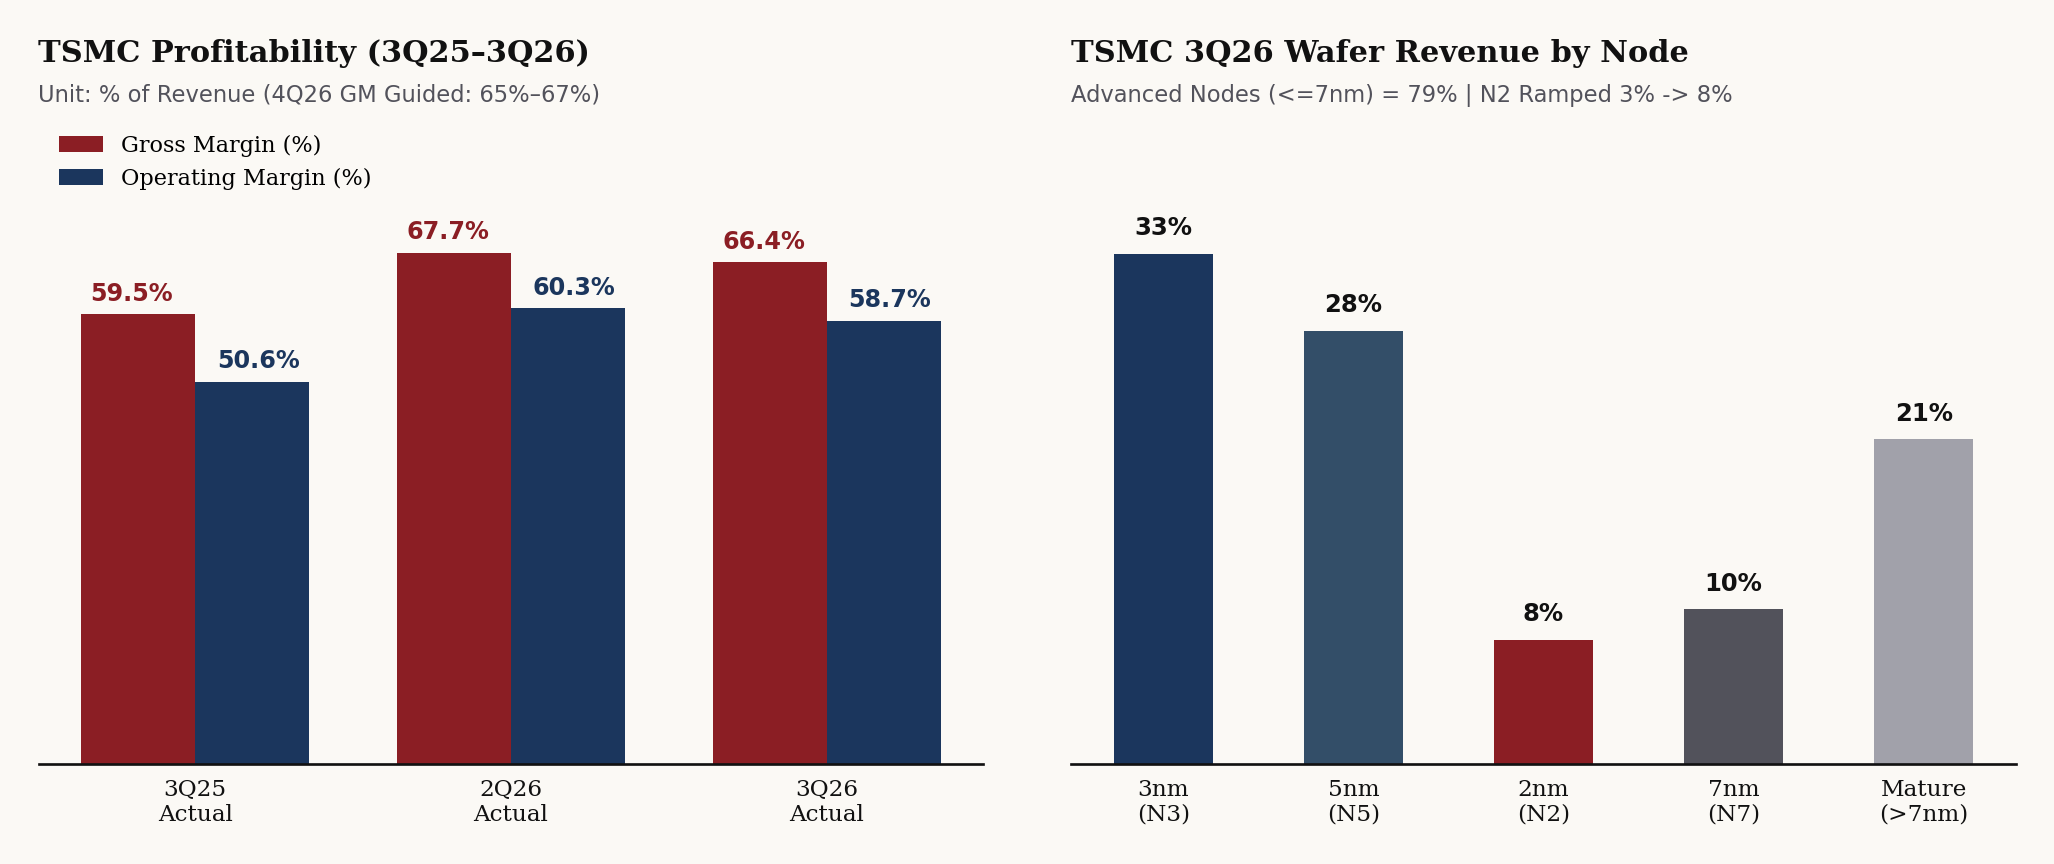
Gross margin (66.4%) and operating margin (58.7%) across 3Q25–4Q26G, alongside 3Q26 advanced node wafer revenue share (<=7nm = 79%, with N2 jumping from 3% to 8%).
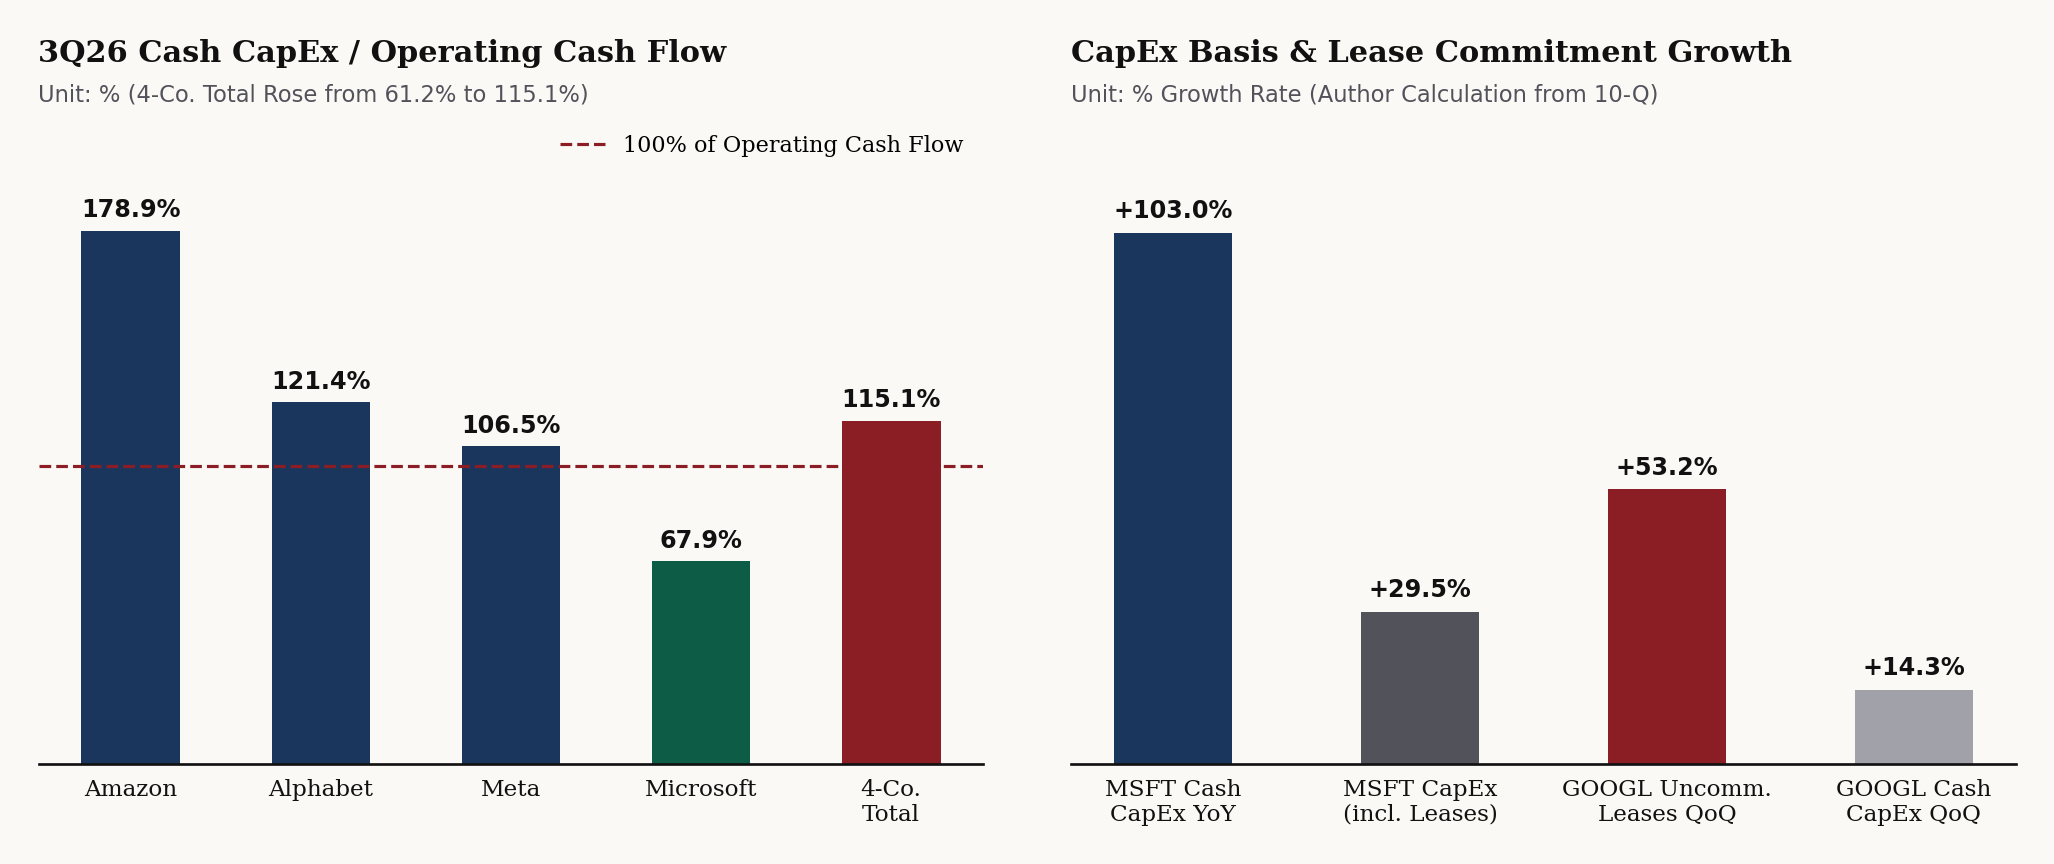
Company-by-company 3Q26 CapEx/OCF (AMZN 178.9%, GOOGL 121.4%, META 106.5%, MSFT 67.9%) and MSFT cash vs. finance-lease basis alongside GOOGL +53.2% QoQ uncommenced lease growth.
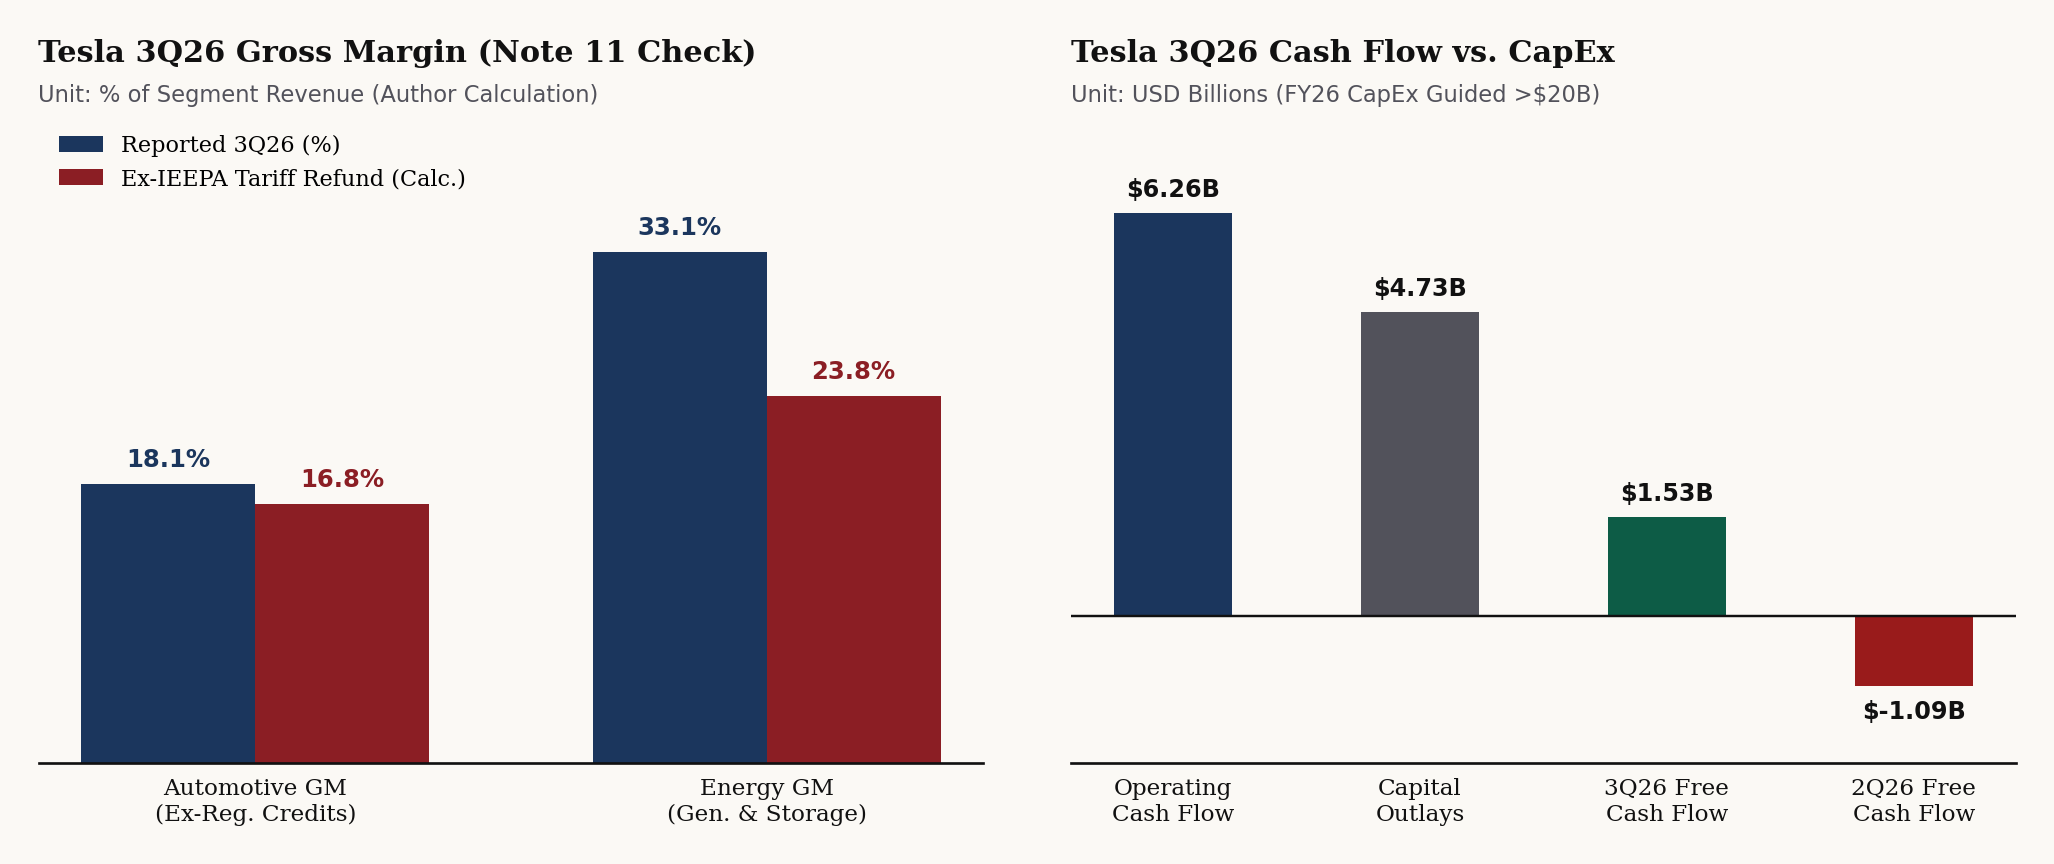
Comparison of reported segment gross margins vs. Note 11 IEEPA tariff refund reversals (~16.8% Auto ex-credit, ~23.8% Energy) and the GAAP OP ($718M) to OCF ($6.263B) and FCF (+$1.531B) bridge.
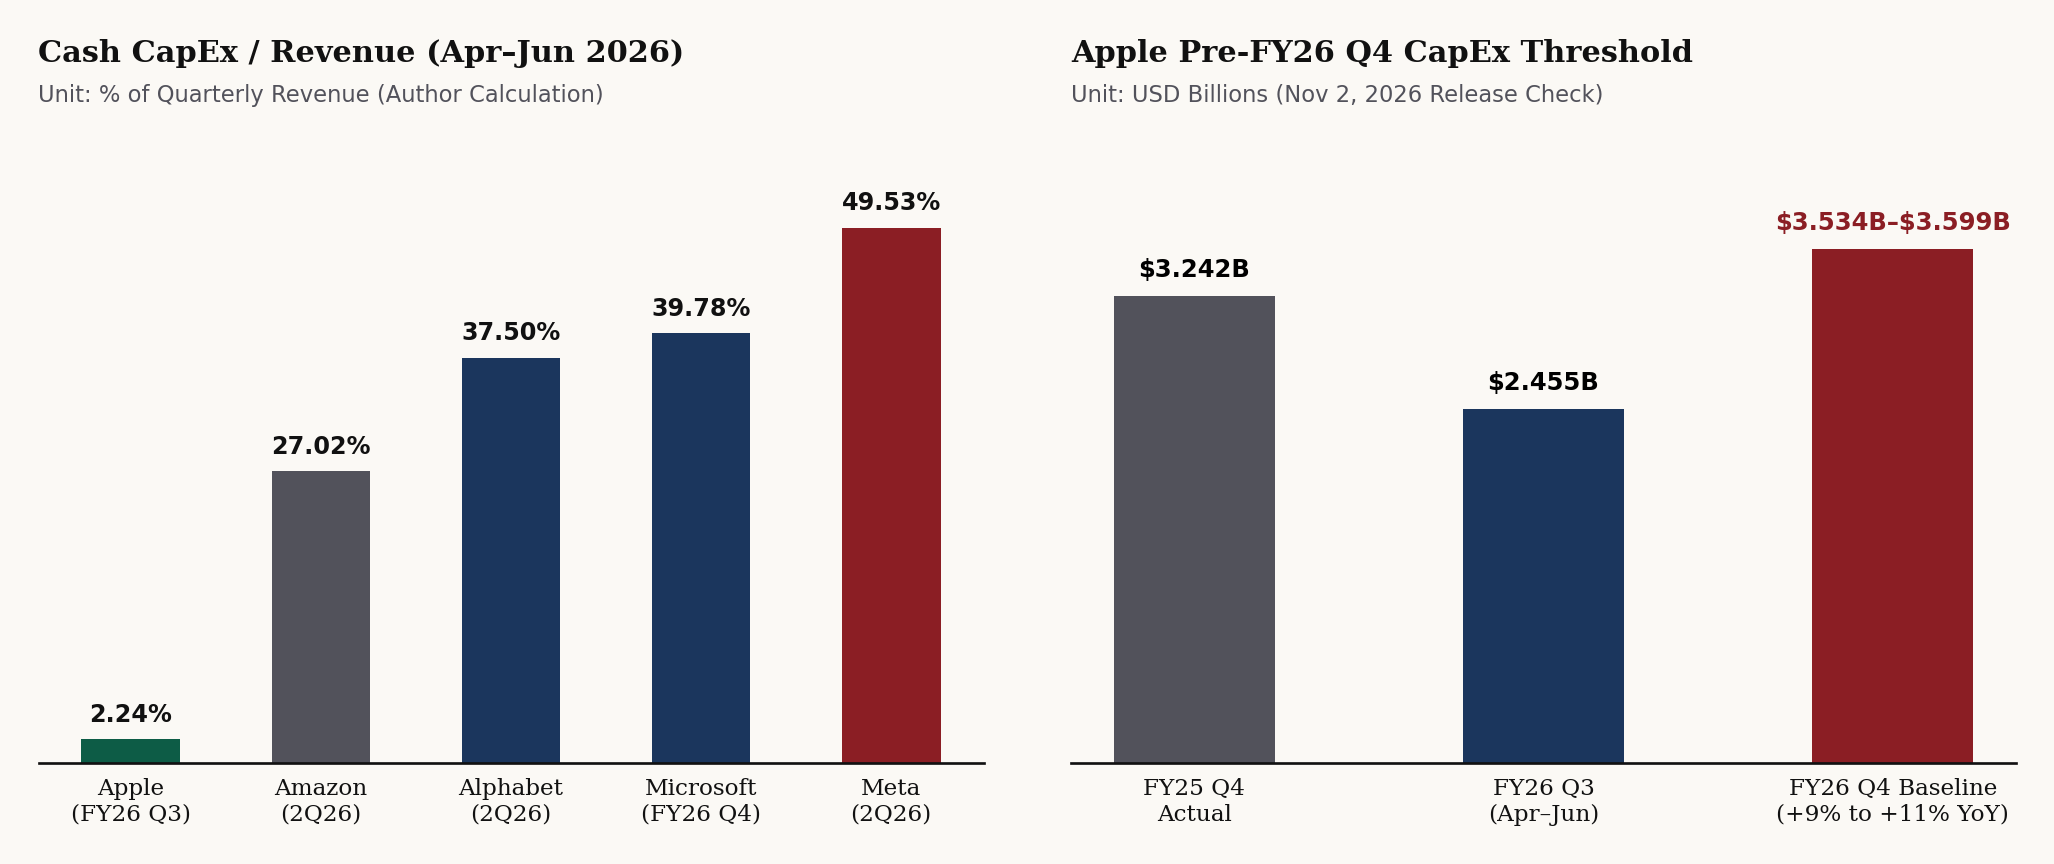
Aligned Apr–Jun 2026 cash CapEx/Revenue (Apple 2.24% vs. peers 27.02%–49.53%) and the $3.534B–$3.599B revenue-paced FY26 Q4 CapEx verification band.
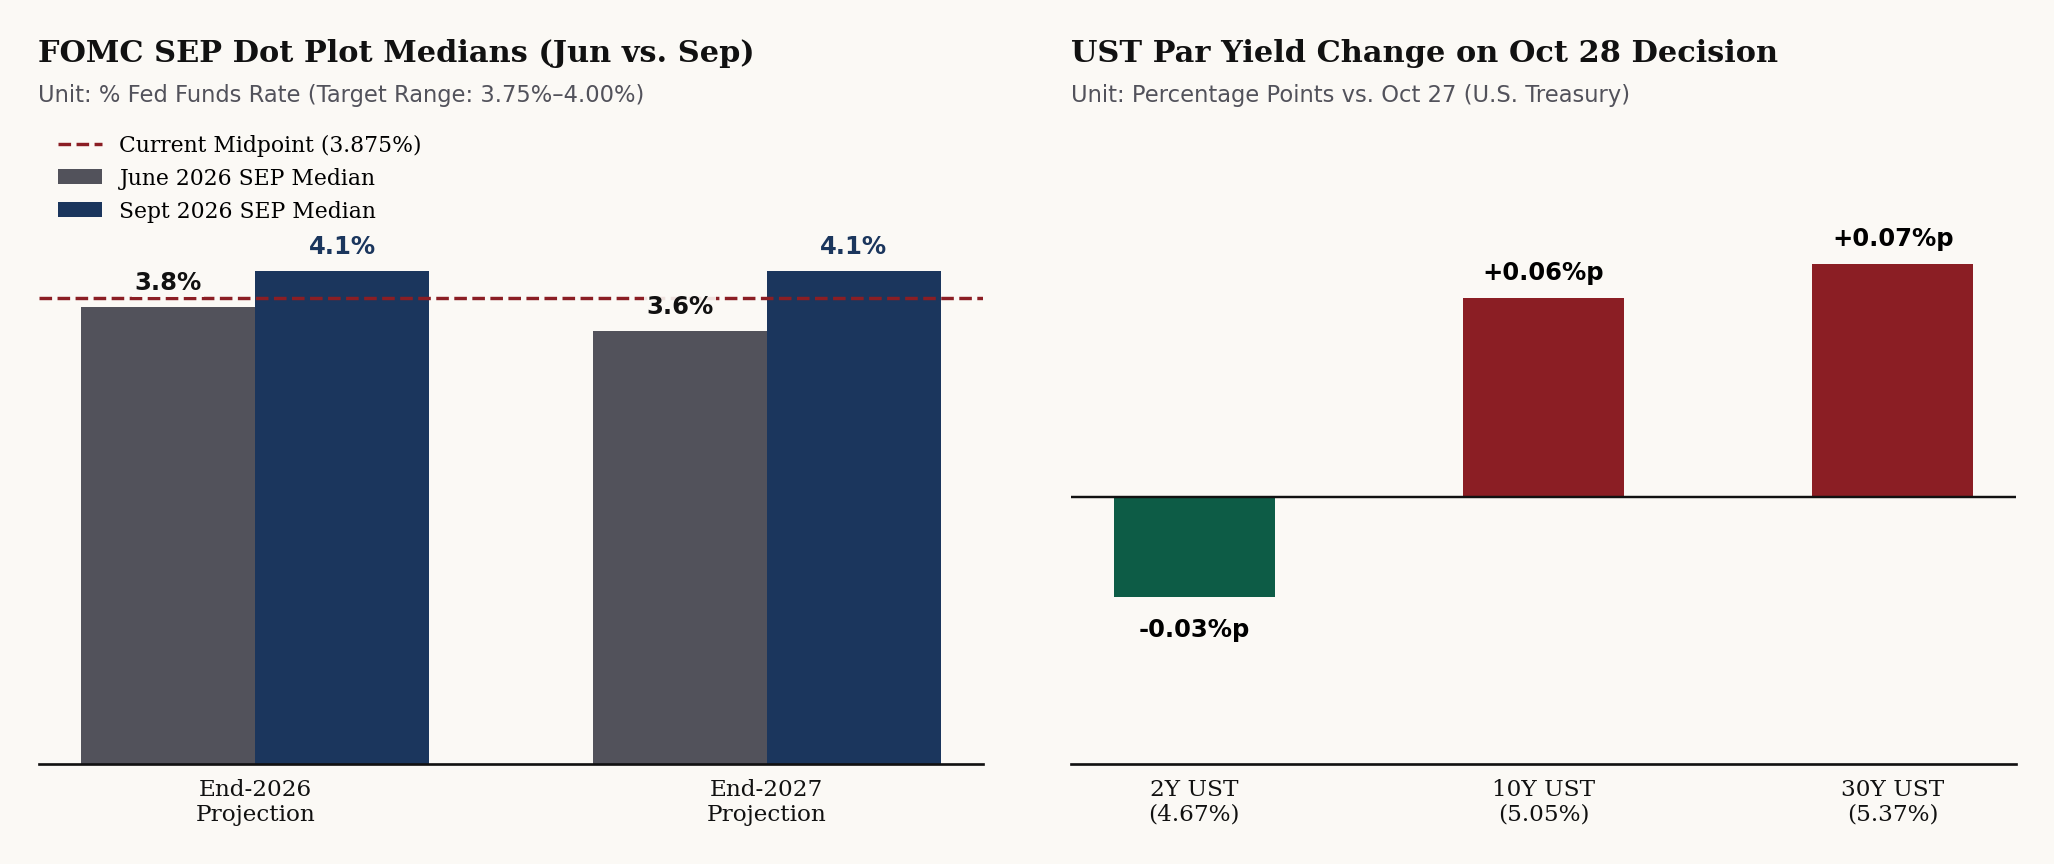
End-2026 and end-2027 SEP median federal funds rate projections (4.1% rounded; 4.125% unrounded 2026 median vs. 3.875% current midpoint) and Oct 28 U.S. Treasury par yield changes.