Big Tech 3Q26 CapEx Scorecard: 4-Firm CapEx ($201.9B, +107.6% YoY) Topped OCF (115.1% CapEx/OCF)
| Issuer & Live Multiples | Valuation Estimate | 6–12M Direction | So What? (Valuation Basis & Catalyst) |
|---|---|---|---|
| Alphabet (GOOGL) $279.84 · Mkt Cap $1.88T · P/E 14.44x · P/B 5.08x | UNDERVALUED | ▲ Top Bullish | +35.9% revenue & +33.0% OP growth trading at just 14.44x P/E — standout value in Big Tech |
| Amazon (AMZN) $240.35 · Mkt Cap $2.60T · P/E 19.00x · P/B 4.23x | UNDERVALUED | ▲ Bullish | Heavy CapEx ($67.1B) depresses FCF, but +124.7% YoY OP surge makes 19.0x P/E highly attractive |
| Microsoft (MSFT) $521.91 · Mkt Cap $3.88T · P/E 29.05x · P/B 8.24x | FAIR VALUE | ▲ Constructive | Only peer keeping cash CapEx/OCF below 100% (67.9%), justifying its 29.05x quality multiple |
| Meta Platforms (META) $614.99 · Mkt Cap $1.60T · P/E 20.75x · P/B 5.77x | FAIR VALUE | ▶ Neutral | +42.1% revenue growth balanced by 106.5% CapEx/OCF and rising long-term debt ($58.7B) |
In 3Q26, 4-hyperscaler gross cash PP&E CapEx surged +107.6% YoY to ~$201.9B while OCF grew +10.4% YoY → combined CapEx/OCF jumped from 61.2% (3Q25) to 115.1% (3Q26), with only Microsoft under 100%.
As of 2026.10.30 · Source: MSFT, GOOGL, META & AMZN Jul–Sep 2026 SEC Filings & Transcripts · Derived ratios marked (Calc.).
1. 4-Company Aggregate: CapEx/OCF Crosses 115.1%
- Uniform Gross Cash Basis (~$201.9B): Summing gross cash PP&E purchases across Microsoft, Alphabet, Meta, and Amazon (excluding finance leases; using gross PP&E before property proceeds/incentives at Amazon) yields ~$201.9B in 3Q26 (+107.6% YoY) vs. +10.4% YoY OCF growth → combined
CapEx / OCF = 115.1%(up from 61.2% in 3Q25) [1][8][11][15]. - Where the Cash Goes: Microsoft's CFO confirmed the majority of CapEx went to shorter-lived CPU/GPU assets and reflected higher memory/storage pricing [3].
| Company | 3Q26 Cash-Basis CapEx (YoY Growth, Calc.) |
|---|---|
| Microsoft (FY27 Q1) | ~$39.4B (+103.0%) · CapEx/OCF: 67.9% |
| Alphabet (3Q26) | ~$51.4B (+114.4%) · CapEx/OCF: 121.4% |
| Meta Platforms (3Q26) | ~$34.9B (+80.2%) · CapEx/OCF: 106.5% |
| Amazon (3Q26) | ~$75.9B (+121.7%) · CapEx/OCF: 178.9% |
2. Company-by-Company Breakdown & Microsoft's Accounting Basis Split
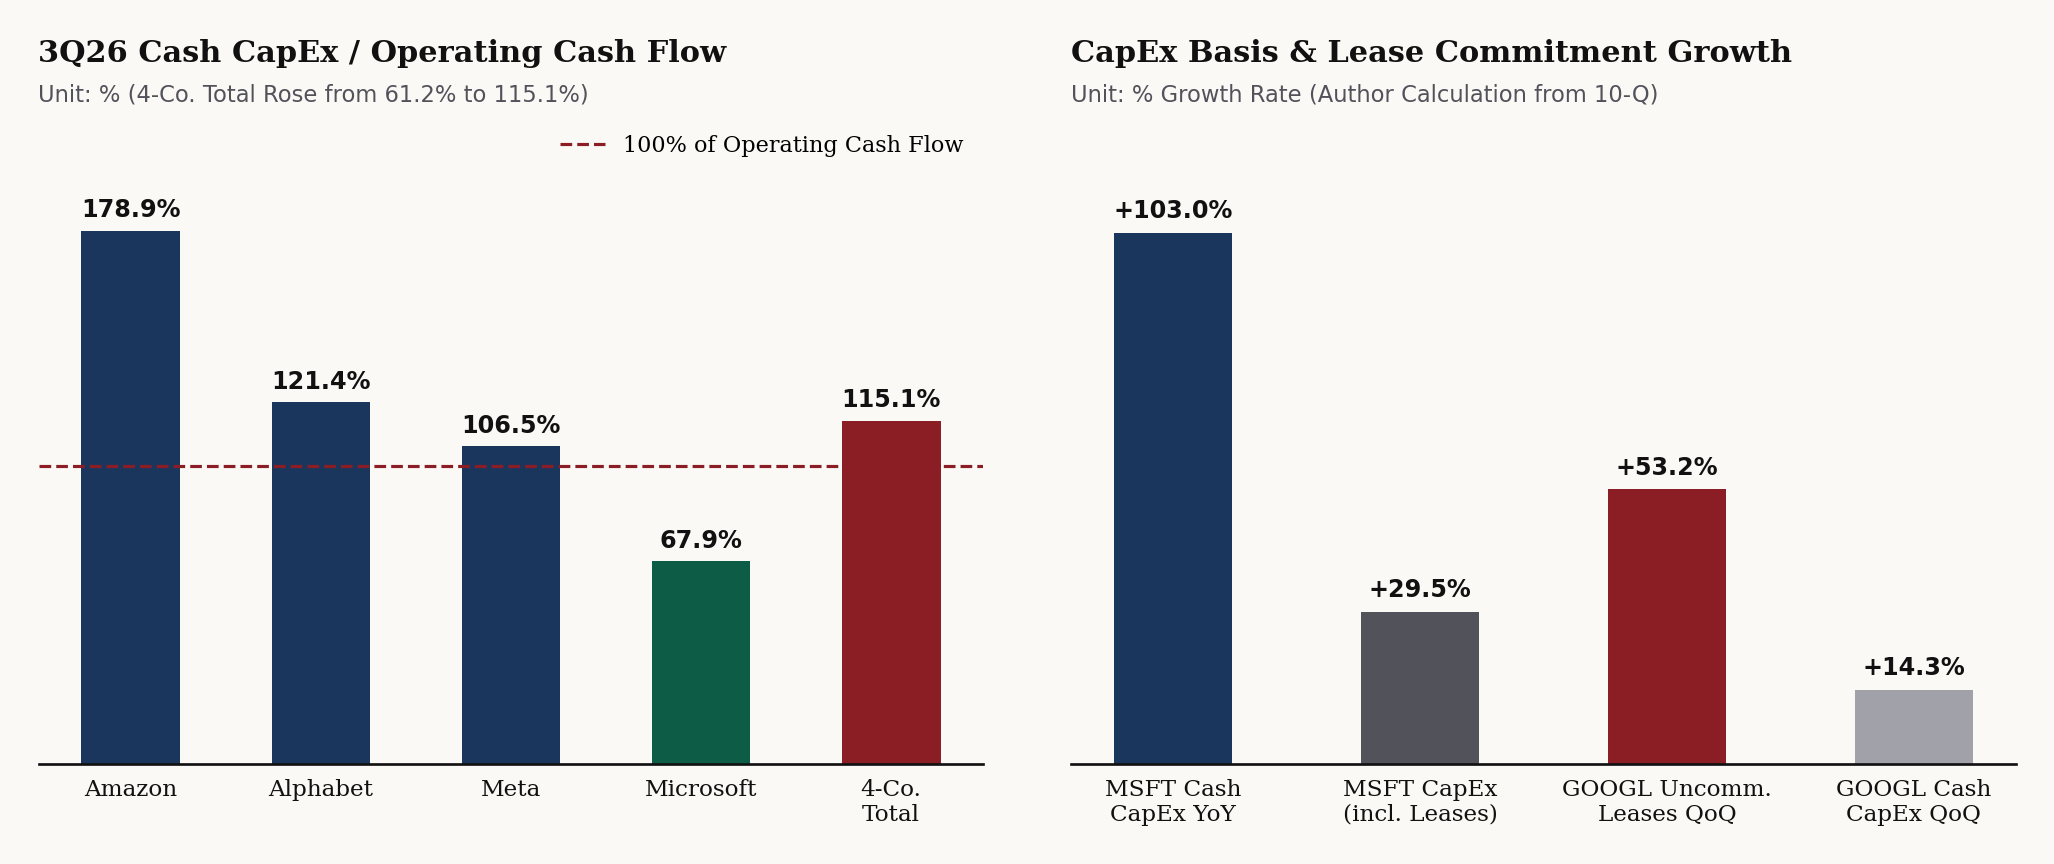
Left: 3Q26 cash-basis CapEx/OCF ratio by company vs. the 4-company combined ratio (115.1%, up from 61.2% in 3Q25). Right: Microsoft YoY growth rate comparison across cash PP&E (+103.0%), reported CapEx incl. finance leases (+29.5%), and OCF (+28.7%), plus Alphabet QoQ uncommenced lease growth (+53.2%) vs. cash CapEx (+14.3%). Source: SEC EDGAR filings, author calculations [1][3][5][8][9][10][11][15].
- Only Microsoft Stayed FCF-Positive: At all four peers, CapEx grew faster YoY than OCF (and Alphabet's OCF declined YoY). On company FCF definitions (
OCF - CapEx, where Meta includes finance lease principal and Amazon nets proceeds), Alphabet and Meta were FCF-negative in 3Q26, Amazon was FCF-negative on a TTM basis, and only Microsoft stayed below 100% CapEx/OCF (both cash and finance-lease-inclusive) [1][3][8][11][15]. - Microsoft Cash (+103.0% YoY) vs. Reported (+29.5% YoY) Divergence: Microsoft's cash-flow PP&E rose +103.0% YoY, whereas presentation CapEx (including finance leases, excluding operating leases) rose +29.5% YoY—matching its +28.7% YoY OCF growth (or +58.8% YoY ex-finance leases on delivery-vs-cash timing, Calc.) [1][3][4][5]. Following Microsoft's July 2026 building useful-life accounting update, finance lease share fell while operating lease additions rose [2][3][4][5].
| Company | Disclosed Forward CapEx Direction |
|---|---|
| Microsoft | Oct–Dec higher than Jul–Sep (reported basis); acceleration in Jan–Jun 2027 and full FY27 growth (calendar 2026 trimmed vs. July solely due to third-party data center delivery delays) [3][4] |
| Alphabet | 2026 technical infrastructure investment to increase substantially over 2025 (no specific dollar figure printed) [9] |
| Meta | Full-year 2026 range implies 4Q26 > 3Q26 (~$49.2B 4Q floor, Calc.); aggressive CapEx growth guided for 2027 [11] |
| Amazon | 2026 full-year outlook maintained, implying ~$47.8B in 4Q26 (Calc., below 3Q26); meaningful increase guided for 2027 [15][16] |
| Observed Outcome in 4Q26 / 1Q27 Filings (±5% Tolerance Band) | How I Will Score It |
|---|---|
| Amazon & Meta: 4Q26 CapEx is not >5% below implied baseline (AMZN ~$47.8B, META floor ~$49.2B) AND 2027 guidance is maintained/raised through 1Q27 | Against Hypothesis 1 (regardless of external financing mix) |
| Alphabet: 2027 CapEx plan and 1Q27 filing maintain or raise current investment pace | Against Hypothesis 1 |
| Microsoft: Quarterly share buybacks do not drop by >5% below 3Q26 (~$4.38B) | Against Hypothesis 1 (if AMZN, GOOGL & META all score Against, Hypothesis 1 is falsified) |
| Full-year guidance cut by >5% (excluding delivery delays), 4Q26 actual >5% below baseline, weaker 2027 plan, or MSFT buybacks down >5% | Supports Hypothesis 1 |
| Uncommenced lease balance rises, yet new assets added under operating + finance leases do not exceed 3Q26 | Against Hypothesis 2 (Meta excluded if new leased assets are not disclosed) |
| Uncommenced lease balance shrinks without new leased assets commencing (cancellations or unmet conditions) | Against Hypothesis 2 |
3. Two Hypotheses: $0 Buybacks, Debt/Equity Issuance & Uncommenced Leases
- Hypothesis 1 (Buybacks Cut to $0 Before CapEx Slows): Across Jan–Sep 2026, Alphabet, Meta, and Amazon repurchased $0 of common stock (vs. ~$39.8B at GOOGL, ~$26.2B at META, and $0 at AMZN in 9M25) [8][9][11][12][16], while Microsoft bought back ~$4.38B in 3Q26 (-22.5% YoY) [1]. Simultaneously, external financing stepped up: Alphabet issued equity (June/3Q) and bonds (3Q); Meta entered preferred/common forward contracts in Oct [14]; Amazon raised 3Q long-term debt [15]; Microsoft priced bonds Oct 29 (settling Nov 4, though MSFT CapEx remains inside OCF) [7].
- Hypothesis 2 (Uncommenced Leases vs. Cash CapEx QoQ): Alphabet uncommenced leases jumped +53.2% QoQ vs. +14.3% QoQ cash CapEx [8][9][10]; Meta uncommenced leases outpaced cash CapEx; Microsoft grew at a similar pace; Amazon cash CapEx grew faster [2][6][12][13][17]. Judgment withheld on 3Q26: both Alphabet and Meta expanded their 3Q26 commitment footnote scope to include energy infrastructure without breaking out the scope-change impact [9][12].
Takeaway & 4Q26 / 1Q27 Checks
- Next-Quarter Audit: (1) Does 4-firm CapEx/OCF stay >100%? (2) Actual Amazon 4Q26 CapEx vs. ~$47.8B implied; (3) Microsoft buybacks vs. ~$4.38B; (4) Uncommenced lease QoQ growth on an unchanged footnote scope.
Sources
- Microsoft FY27 Q1 Earnings Release (Form 8-K Exhibit 99.1), 2026.10.28.
- Microsoft Form 10-Q (Ended Sept 30, 2026, Note 12 Leases), 2026.10.28.
- Microsoft FY27 Q1 Earnings Call Transcript, 2026.10.28.
- Microsoft FY26 Q4 Earnings Call Transcript, 2026.07.29.
- Microsoft FY26 Q1 Earnings Call Transcript, 2025.10.29.
- Microsoft FY26 Form 10-K (Leases Footnote), 2026.07.29.
- Microsoft Bond Pricing Term Sheet (Filing FWP), 2026.10.29.
- Alphabet 3Q26 Earnings Release (Form 8-K Exhibit 99.1), 2026.10.28.
- Alphabet Form 10-Q (Ended Sept 30, 2026, MD&A & Note 4 Leases), 2026.10.29.
- Alphabet Form 10-Q (Ended June 30, 2026, Note 4 Leases), 2026.07.23.
- Meta Platforms 3Q26 Earnings Release (Form 8-K Exhibit 99.1), 2026.10.21.
- Meta Platforms Form 10-Q (Ended Sept 30, 2026, Note 10 Commitments), 2026.10.22.
- Meta Platforms Form 10-Q (Ended June 30, 2026), 2026.07.30.
- Meta Platforms Preferred Stock & Forward Contract Form 8-K, 2026.10.26.
- Amazon 3Q26 Earnings Release (Form 8-K Exhibit 99.1), 2026.10.29.
- Amazon Form 10-Q (Ended Sept 30, 2026, MD&A & Note 4), 2026.10.30.
- Amazon Form 10-Q (Ended June 30, 2026, Note 4 Commitments), 2026.07.31.
Get Primary Korean DART (K-IFRS) & Asia Semiconductor Filing Notes Before Secondary Wires
Receive direct email alerts whenever a new Korean FSS DART preliminary earnings note, treasury-share burn check, or U.S. SEC CapEx cross-check is published. 100% free, one-way analytical record.
Reader Discussion & Filing Notes (0)
Discuss K-IFRS footnotes, DART
rcpNodisclosures, KOSPI/KOSDAQ valuation gaps, or test the falsifiable hypotheses in this note. Free reader accounts take 10 seconds to create.