Samsung Electronics 3Q26 DART Audit: DS 72.4% OPM vs. SK Hynix 79.7% (7.3pp Gap)
| Issuer & Live Multiples | Valuation Estimate | 6–12M Direction | So What? (Valuation Basis & Catalyst) |
|---|---|---|---|
| SK Hynix (000660.KS) Mkt Cap 1,083T KRW · P/E 6.61x · Fwd P/E 4.17x · Cap/Ann.OP 3.25x | UNDERVALUED | ▲ Top Bullish | 79.7% OPM & 98.7T KRW net cash at 4.17x Fwd P/E makes it the cheapest AI bottleneck asset |
| Samsung Elec (005930.KS) Mkt Cap 1,343T KRW · P/E 10.31x · Fwd P/E 5.00x · P/B 2.67x | UNDERVALUED | ▲ Bullish | Trading at just 2.96x annualized 3Q OP (5.00x Fwd P/E); non-memory drag already priced in |
SK Hynix consolidated OPM (79.7%) vs. Samsung DS OPM (72.4%): the gap compressed from 25.4pp (3Q25) to 5.8pp (1Q26), then re-widened for two quarters to 7.3pp in 3Q26.
As of 2026.10.30 · Source: Samsung Electronics & SK Hynix DART Fair Disclosures & 3Q26 IR Decks · Derived ratios marked (Calc.).
1. 3Q26 DS Division vs. Standalone Memory Boundary (75.7%)
- Reporting Scope Difference: Both companies report on a K-IFRS consolidated basis for July 1–September 30, 2026 [1][2][7]. Samsung discloses standalone Memory revenue (140.7T KRW) but reports operating profit only at the broader DS division level (Memory + System LSI + Foundry) [3], whereas SK Hynix's consolidated print includes NAND subsidiary Solidigm [7].
- 3Q26 Headline & Segment Numbers: Samsung consolidated revenue 195.25T KRW, OP 107.44T KRW [1]. Inside DS: revenue 147.1T KRW, OP 106.5T KRW → DS OPM = 72.4% (Calc.) [3].
- HBM4 & Base-Die Accounting Nuance: Server demand lifted memory prices across applications and HBM4 sales expanded sharply [4]. Foundry revenue/profit also improved on HBM base-die logic sales and leading-edge orders [4] → HBM base-die revenue sits inside Foundry (external vs. inter-segment split undisclosed), while FX was sequentially unfavorable for components [5].
| K-IFRS Filing Metric (3Q26) | Verified DART & IR Figures |
|---|---|
| Samsung Consolidated (3Q26) | Revenue 195.25T KRW, Operating Profit 107.44T KRW [1] |
| Samsung DS Division (Semiconductors) | Revenue 147.1T KRW, Operating Profit 106.5T KRW → 72.4% DS OPM (Calc.) (blends Memory + System LSI + Foundry) [3] |
| Samsung Memory Standalone | Revenue 140.7T KRW (OP undisclosed; DS OP / Memory Rev sets a 75.7% boundary, Calc.) [3] |
| SK Hynix Consolidated (3Q26) | Operating Margin 79.7% (Calc. from DART; printed as 80% in company deck) [7][8] |
| 5-Quarter OPM Gap (SK Hynix − Samsung DS) | 3Q25 25.4pp → 4Q25 21.1pp → 1Q26 5.8pp → 2Q26 6.4pp → 3Q26 7.3pp (Calc.) |
| 3Q26 CapEx (Facility Plan vs. Cash PP&E) | Samsung facility CapEx 29.0T KRW (FY26 plan 84.4T, 9M 56.9T, implied 4Q ~27.5T); Cash PP&E: Samsung 26.9T KRW vs. SK Hynix 12.67T KRW |
2. SK Hynix vs. Samsung DS: 5-Quarter Margin Trajectory
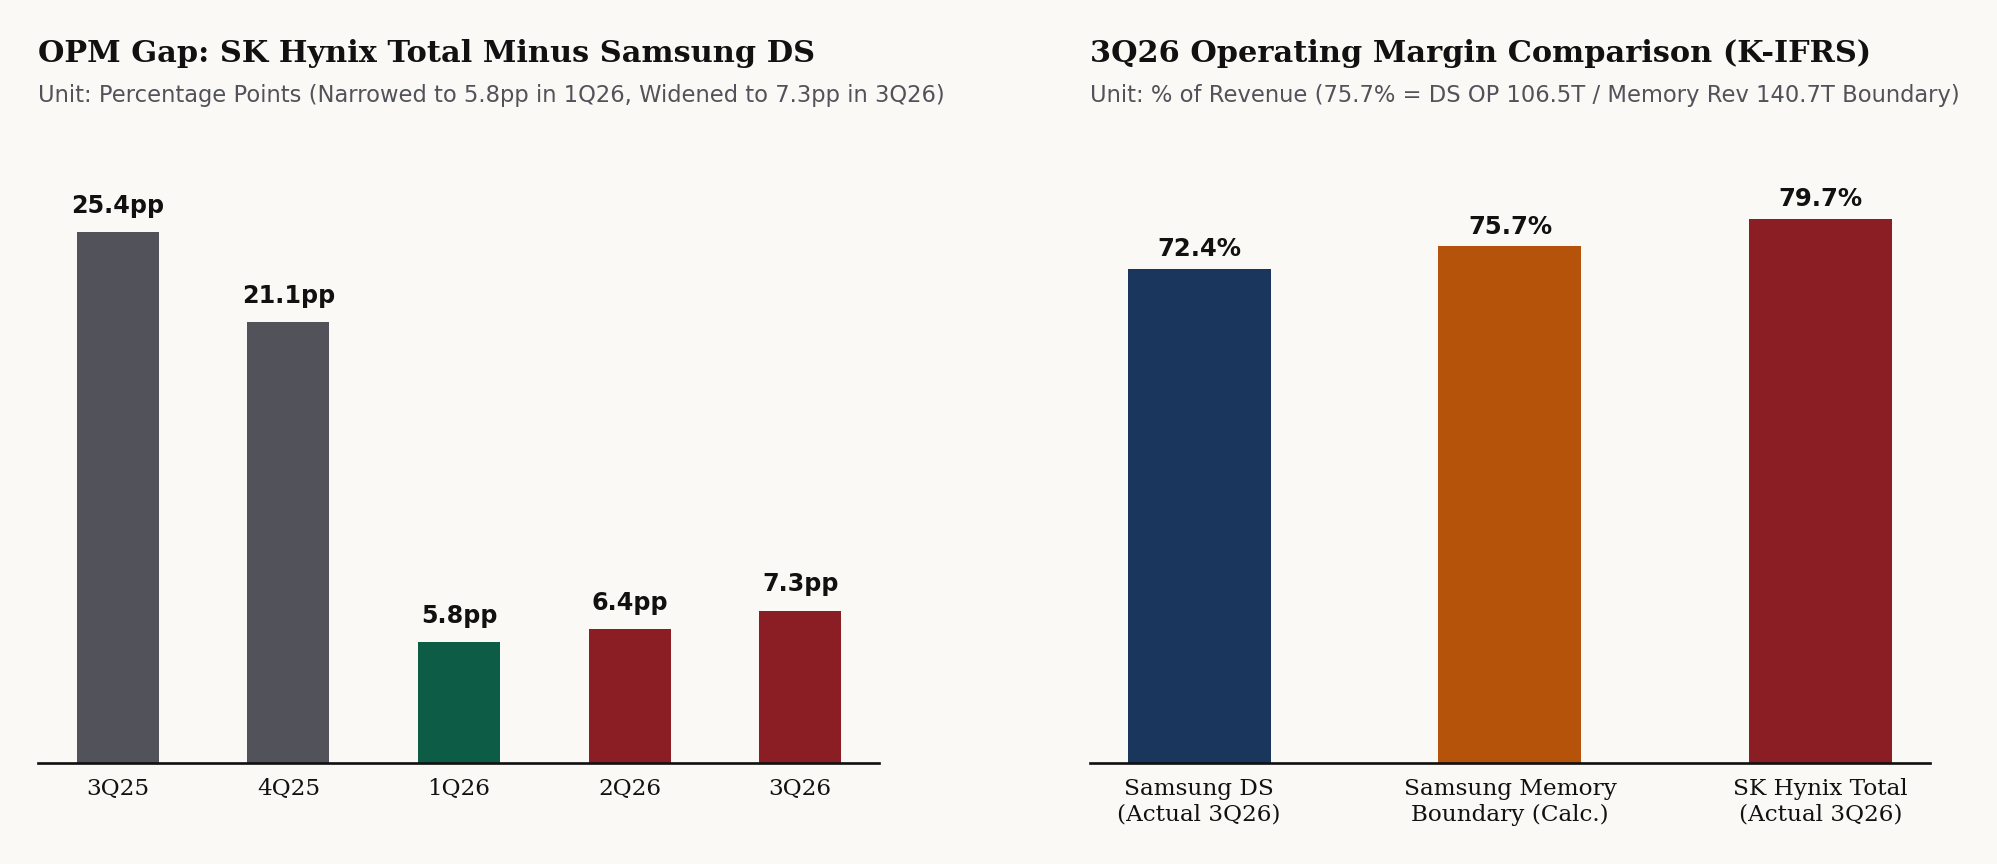
Left: 5-quarter operating margin gap (SK Hynix consolidated OPM minus Samsung DS OPM, in percentage points). Right: 3Q26 operating margin comparison showing Samsung DS (72.4%), the mathematical boundary for Samsung Memory if non-memory DS is non-negative (75.7%, Calc.), and SK Hynix consolidated (79.7%). Source: Samsung 4Q25–3Q26 IR decks & SK Hynix DART filings [3][7][10][11][13].
- Mathematical Boundary for Standalone Memory OPM: SK Hynix 3Q26 unrounded DART OPM = 79.7% (80% in IR deck) [7][8]. Dividing Samsung DS OP (106.5T KRW) by standalone Memory revenue (140.7T KRW) gives 75.7% (Calc.) [3].
•If System LSI + Foundry OP ≥ 0 => Samsung Memory OPM ≤ 75.7%(still below SK Hynix's 79.7%).
•If System LSI + Foundry OP < 0 => Samsung Memory OPM > 75.7%(narrowing the true memory gap). - 5-Quarter Proxy Gap (SK Hynix Consolidated OPM minus Samsung DS OPM): 25.4pp (3Q25) → 21.1pp (4Q25) → 5.8pp (1Q26) → 6.4pp (2Q26) → 7.3pp (3Q26) [3][7][10][11][13].
3. Facility CapEx Plan vs. Cash Flow Statement PP&E Outlays
- Samsung 4Q26 Implied Facility Investment: 3Q26 facility investment was 29.0T KRW [4] against the 2026 annual plan of 84.4T KRW [6]. Subtracting 9M26 cumulative investment (56.9T KRW) leaves
84.4T - 56.9T = ~27.5T KRWimplied for 4Q26 [4][6]. - Cash PP&E Outflow Comparison (3Q26 Cash Flow Statement): Samsung 26.9T KRW vs. SK Hynix 12.67T KRW [3][8]. Both project AI memory demand to exceed supply into 2027 (Samsung guiding double-digit Foundry QoQ growth in 4Q26; SK Hynix guiding higher 2027 CapEx) [4][8].
Takeaway & Next-Quarter Checks
- Hypothesis 1 (HBM Share vs. Commodity DRAM): Currently untestable from public filings because HBM revenue share, standalone Memory OP, and Foundry base-die inter-segment eliminations are undisclosed [3][4][8].
- Hypothesis 2 (Does Rising DRAM Pricing Compress the Gap?): Across the 4 rising-price quarters (4Q25 [11], 1Q26 [12], 2Q26 [9][10], 3Q26 [4]), the gap narrowed twice (4Q25, 1Q26) and widened twice (2Q26, 3Q26) → mixed (2-for-2); check whether 4Q26 narrows below 7.3pp.
Sources
- DART Samsung Electronics Preliminary 3Q26 Earnings Fair Disclosure, 2026.10.29.
- DART Samsung Electronics Amended Preliminary 3Q26 Earnings Fair Disclosure, 2026.10.29.
- Samsung Electronics 3Q26 Earnings Call IR Presentation (PDF, pp. 6–7, 13, 15), 2026.10.29.
- Samsung Global Newsroom: Samsung Electronics Announces Third Quarter 2026 Results, 2026.10.29.
- Samsung Korea Newsroom: 3Q 2026 Earnings Release, 2026.10.29.
- DART Samsung Electronics Future Business & Management Plan (2026 CapEx Guidance), 2026.10.29.
- DART SK Hynix Preliminary 3Q26 Earnings Fair Disclosure, 2026.10.28.
- SK Hynix FY2026 Q3 Earnings IR Presentation (PDF, pp. 5, 11–12, 16–17), 2026.10.28.
- Samsung Global Newsroom: Second Quarter 2026 Results, 2026.07.30.
- Samsung Electronics 2Q26 Earnings IR Presentation (PDF, p. 7), 2026.07.30.
- Samsung Electronics 4Q25 Earnings IR Presentation (PDF, p. 8), 2026.01.29.
- Samsung Electronics 1Q26 Earnings IR Presentation (PDF, p. 7), 2026.04.30.
- DART SK Hynix Preliminary 4Q25 Earnings Fair Disclosure, 2026.01.28.
Get Primary Korean DART (K-IFRS) & Asia Semiconductor Filing Notes Before Secondary Wires
Receive direct email alerts whenever a new Korean FSS DART preliminary earnings note, treasury-share burn check, or U.S. SEC CapEx cross-check is published. 100% free, one-way analytical record.
Reader Discussion & Filing Notes (0)
Discuss K-IFRS footnotes, DART
rcpNodisclosures, KOSPI/KOSDAQ valuation gaps, or test the falsifiable hypotheses in this note. Free reader accounts take 10 seconds to create.