FinTwit Institutional 4:3 Chart Sheets (1200x900 @2x) & Vertical Bullet Posts
Asia Filing Notes — X (FinTwit) Publishing Studio
Authenticated X Account & Live Status
Handle:
Flagship Live Post: Ready for 1-Click Post
@seongminparkkor · Profile Updated: FalseFlagship Live Post: Ready for 1-Click Post
Configured X Bio & Verified Links
Bio: Korea (DART K-IFRS) & Asia Semiconductor Primary-Filing Notes | #SKHynix $HXSCL #Samsung $SSNLF $TSM $NVDA $MU | Newsletter: asia-filing-notes.pages.dev/substack
Website: https://asia-filing-notes.pages.dev · Open Newsletter & Substack Archive →
Website: https://asia-filing-notes.pages.dev · Open Newsletter & Substack Archive →
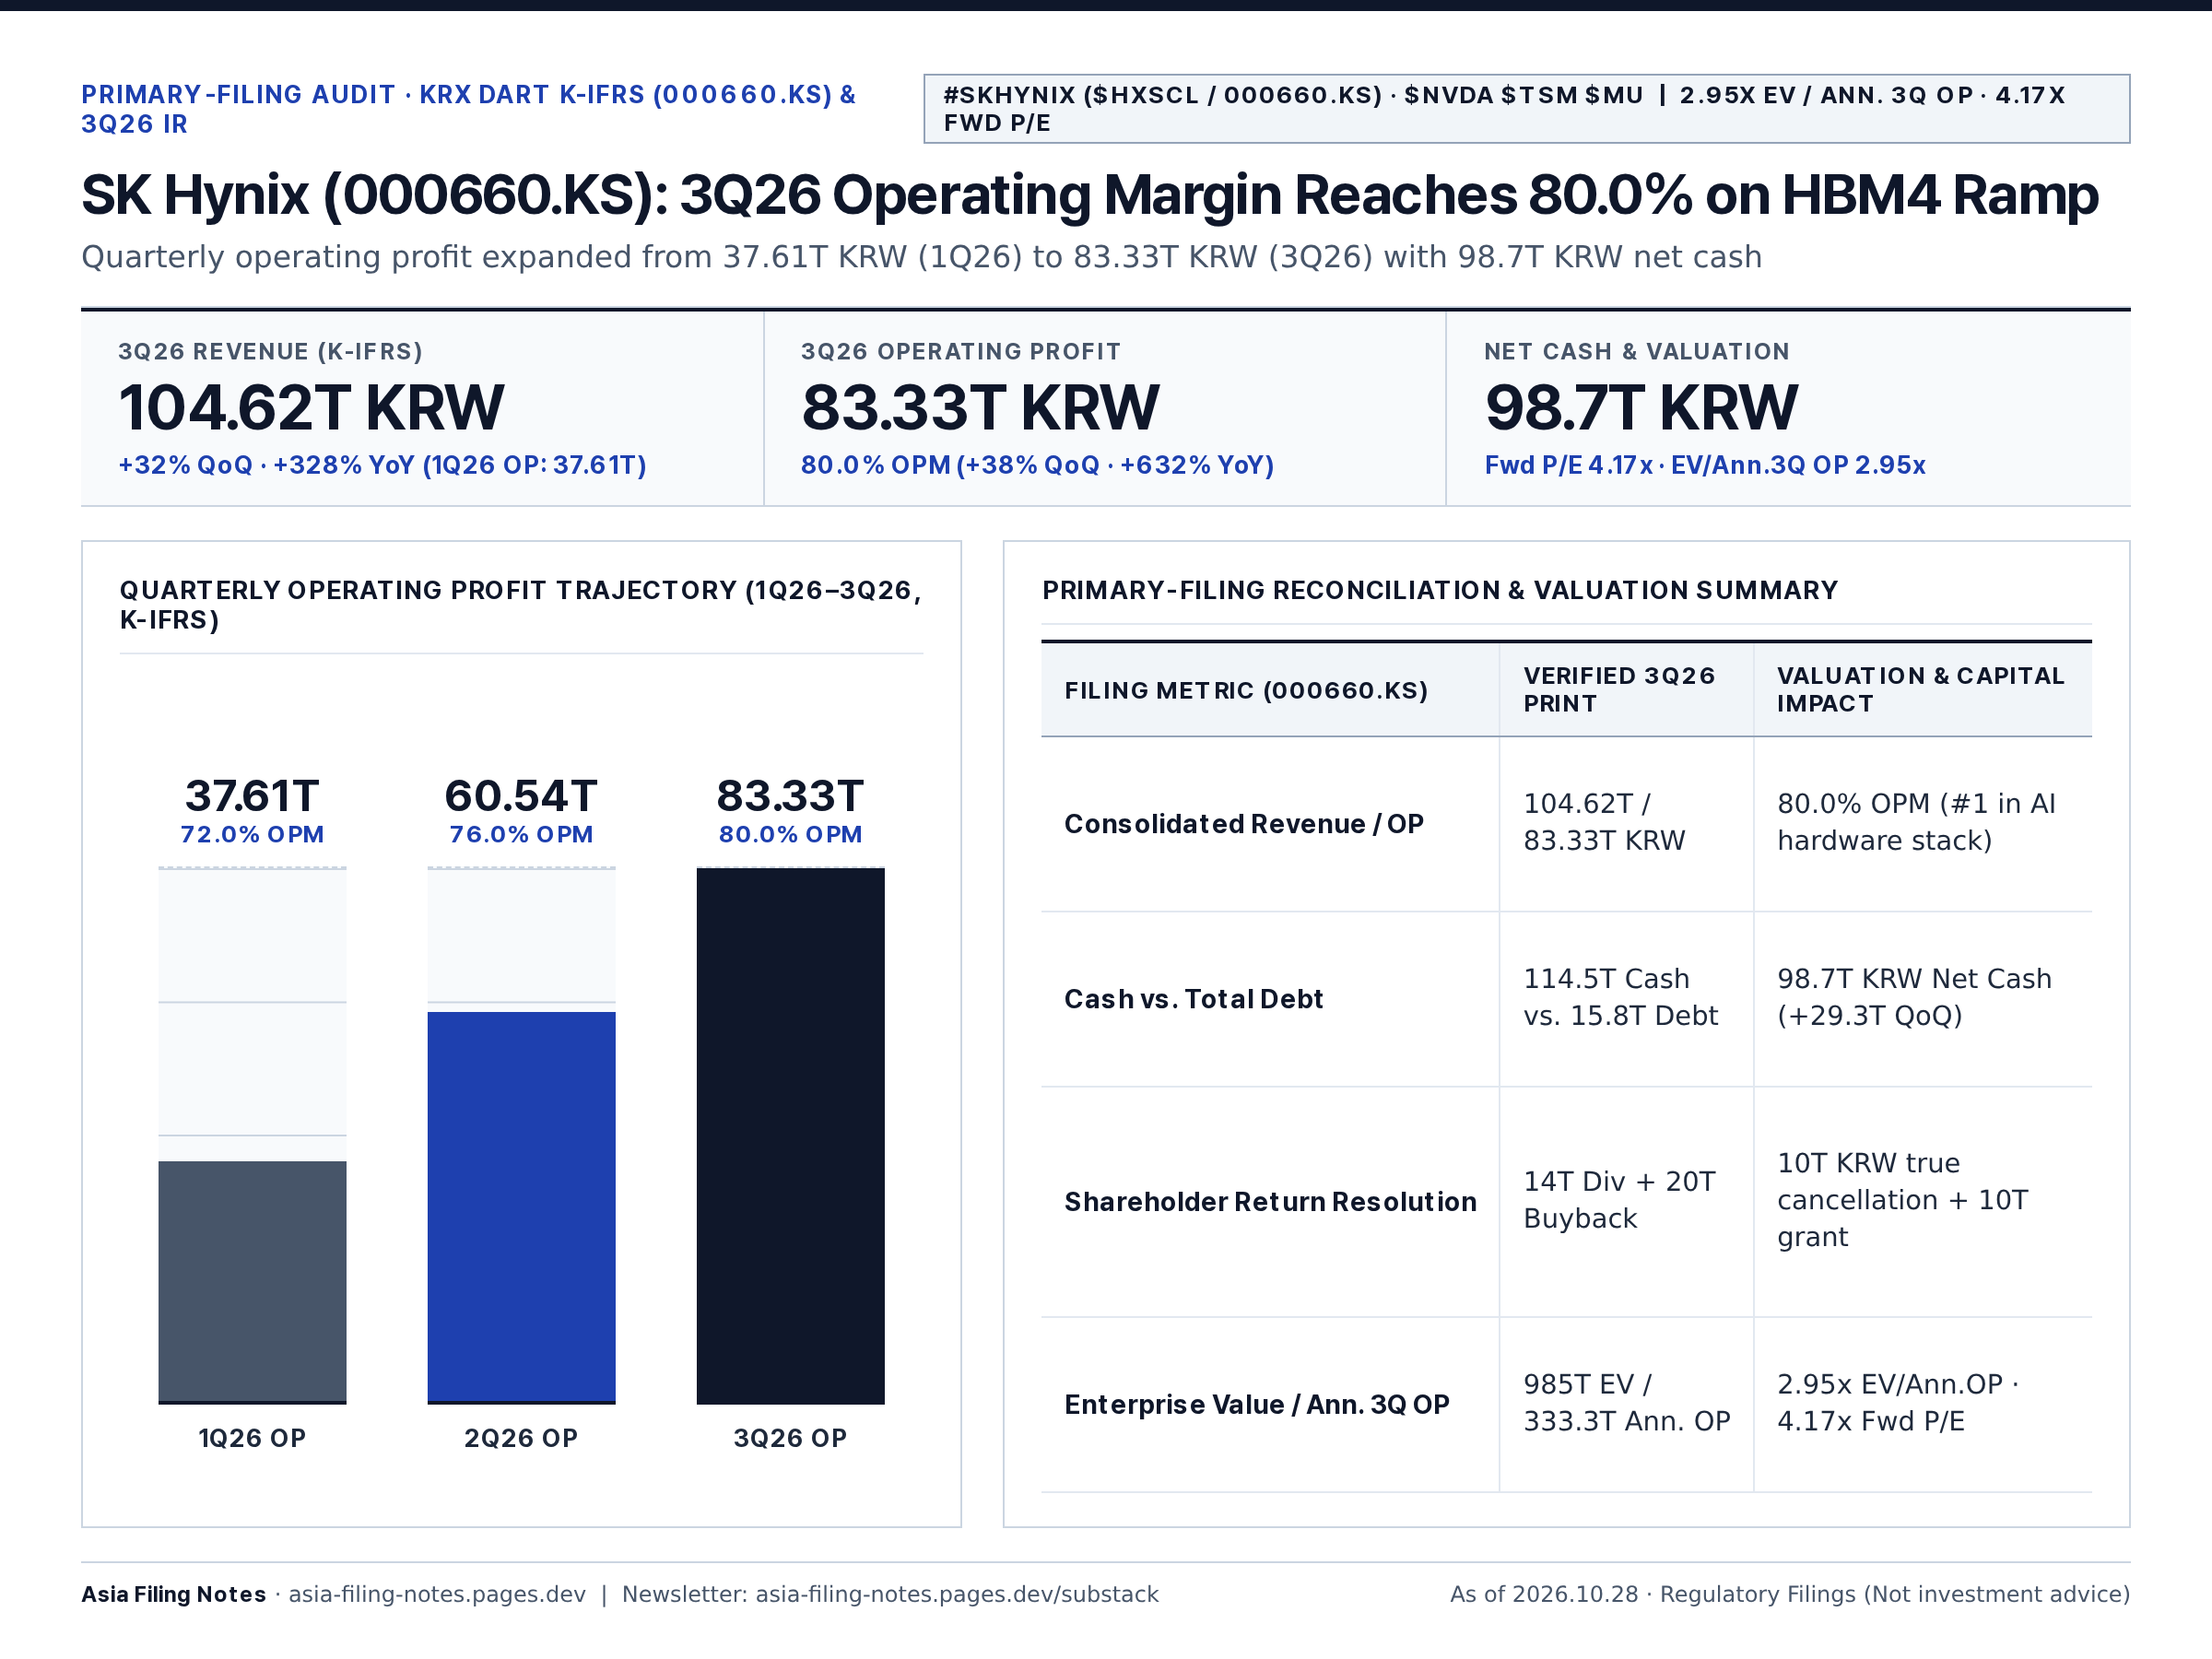
#01 · #SKHynix ($HXSCL / 000660.KS) · $NVDA $TSM $MU
2.95x EV / Ann. 3Q OP · 4.17x Fwd P/E
SK Hynix (000660.KS): 3Q26 Operating Margin Reaches 80.0% on HBM4 Ramp
FinTwit Vertical Bullet Post (247/280 chars · 100% English)
1-Click Post on X →
Download 1200x900 PNG
Portal Note →
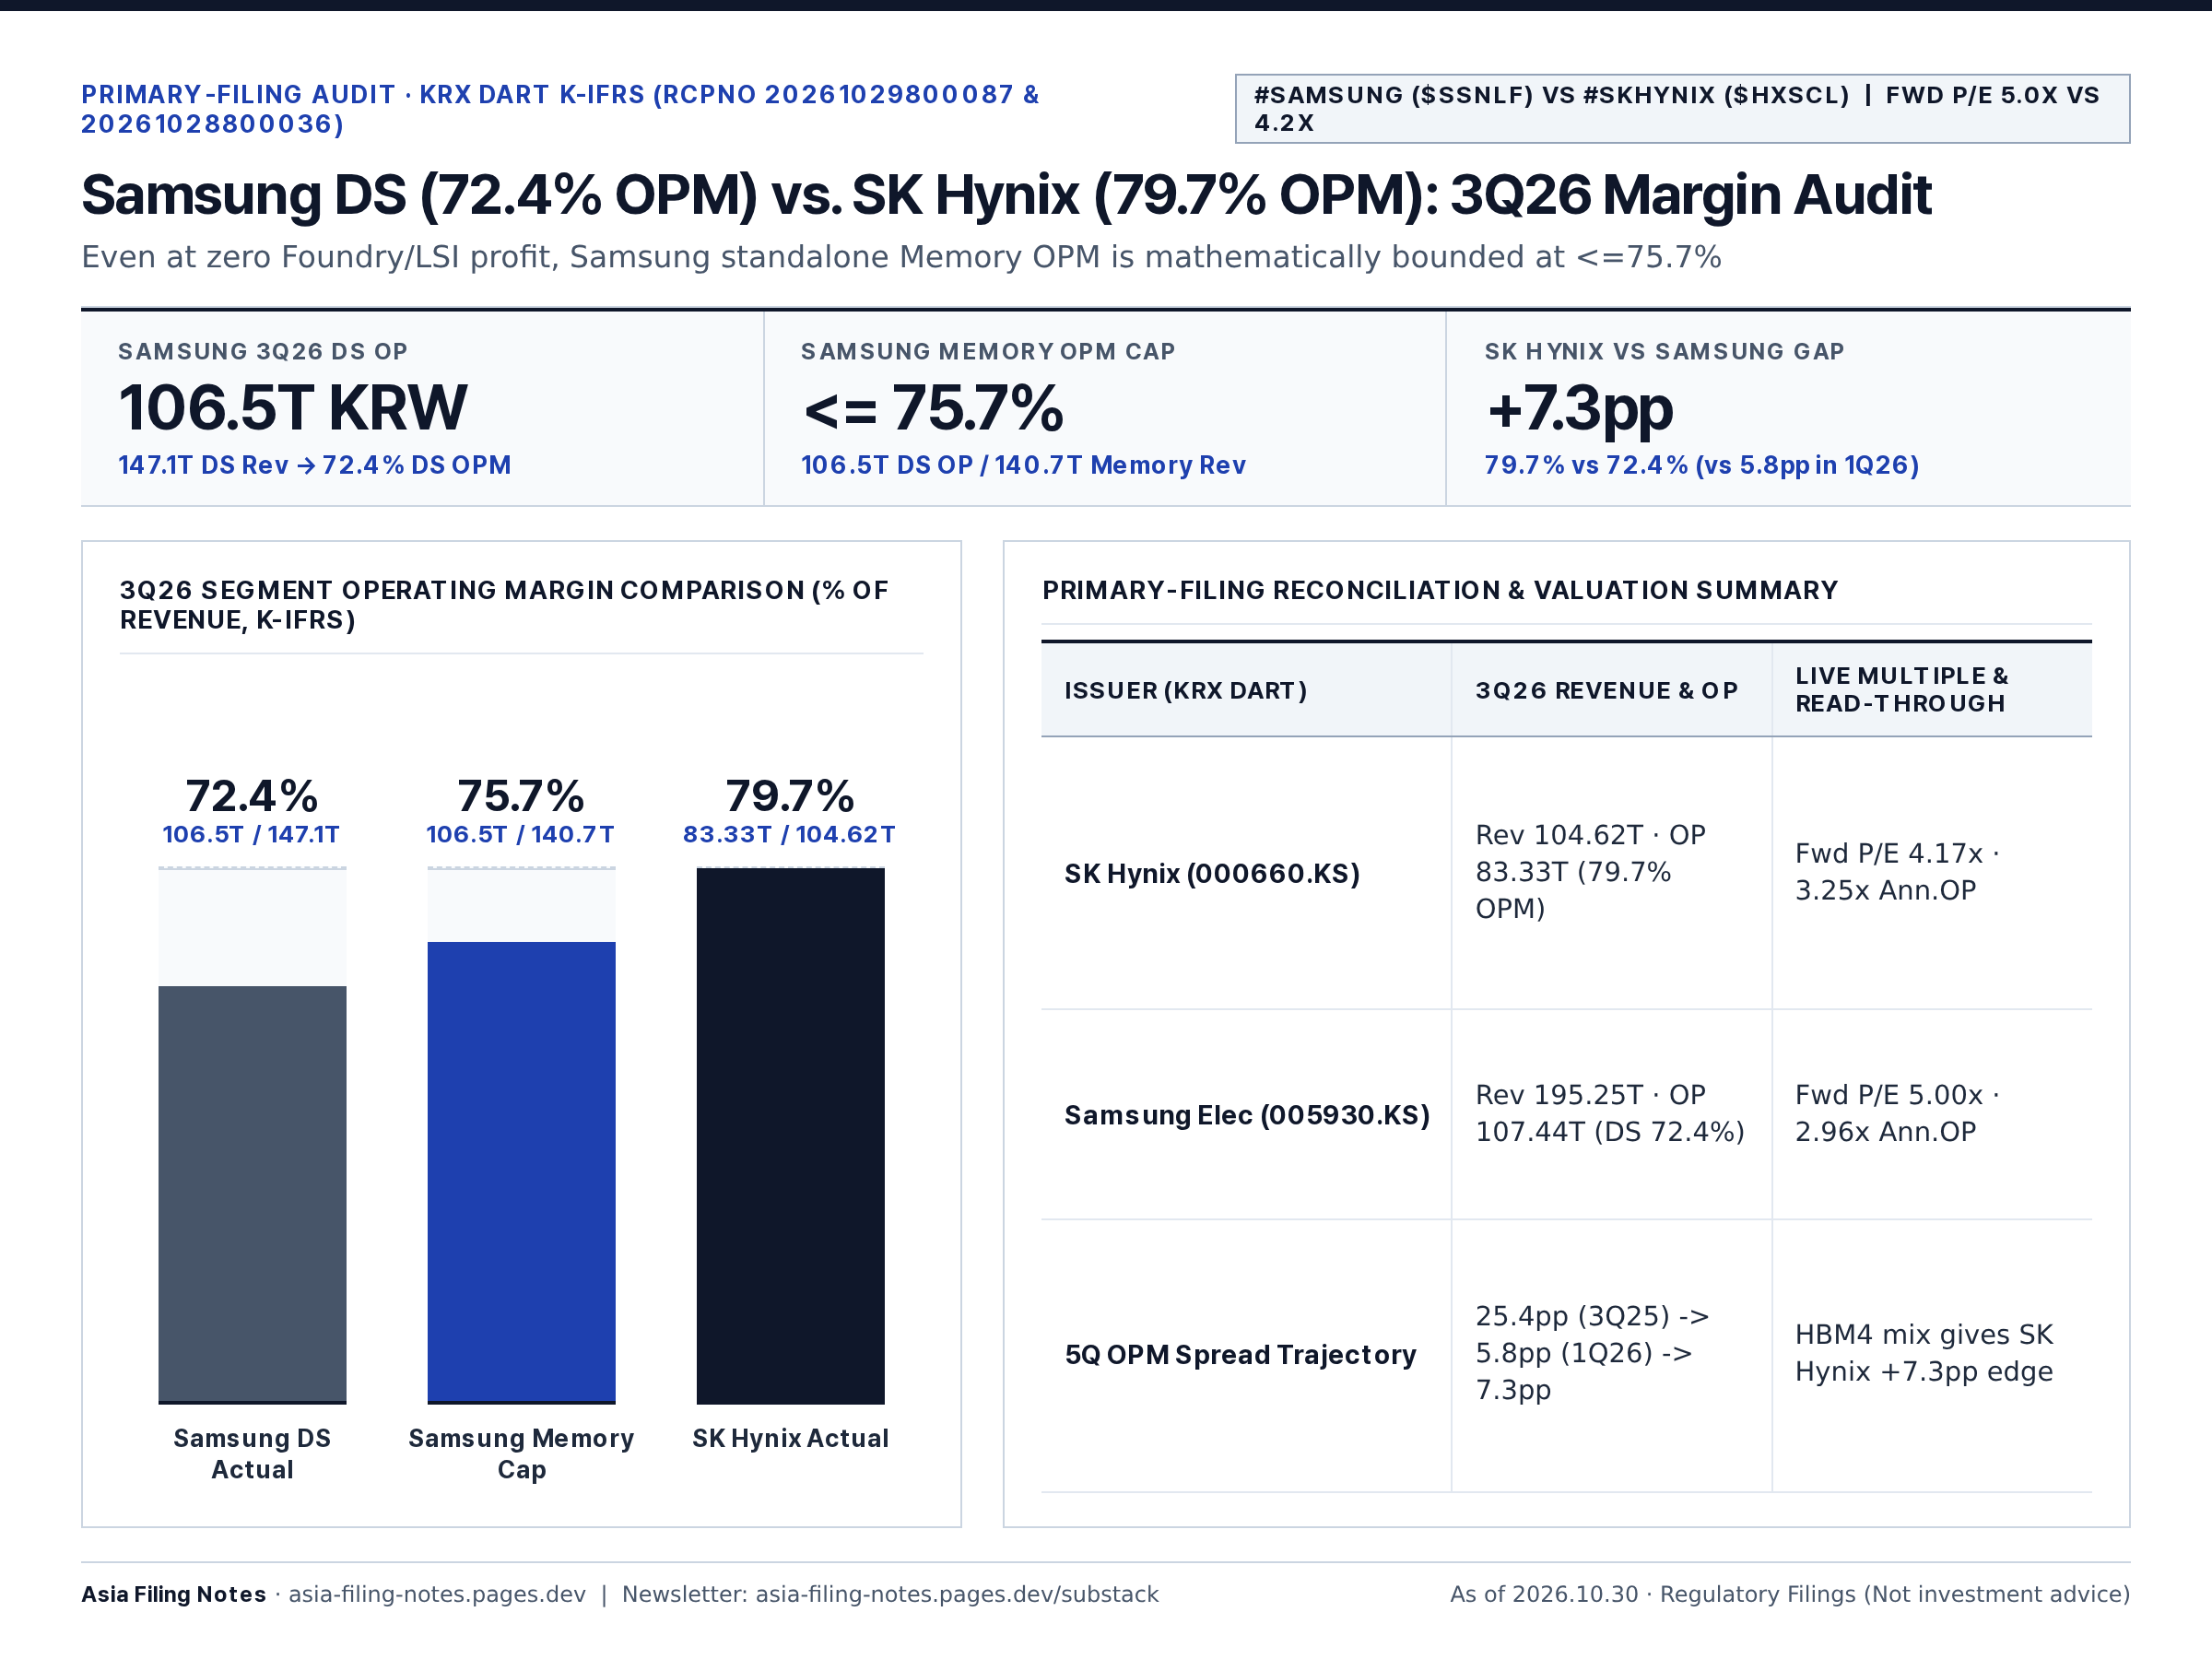
#02 · #Samsung ($SSNLF) vs #SKHynix ($HXSCL)
Fwd P/E 5.0x vs 4.2x
Samsung DS (72.4% OPM) vs. SK Hynix (79.7% OPM): 3Q26 Margin Audit
FinTwit Vertical Bullet Post (244/280 chars · 100% English)
#Samsung ($SSNLF / 005930.KS) DS vs. #SKHynix ($HXSCL / 000660.KS) 3Q26 margin audit:

• Samsung DS OPM: 72.4% (106.5T OP)
• Samsung Memory Cap: <=75.7% (at 0 Foundry OP)
• SK Hynix OPM: 79.7% (+7.3pp edge)

4.2x–5.0x Fwd P/E vs $MU $NVDA $TSM.
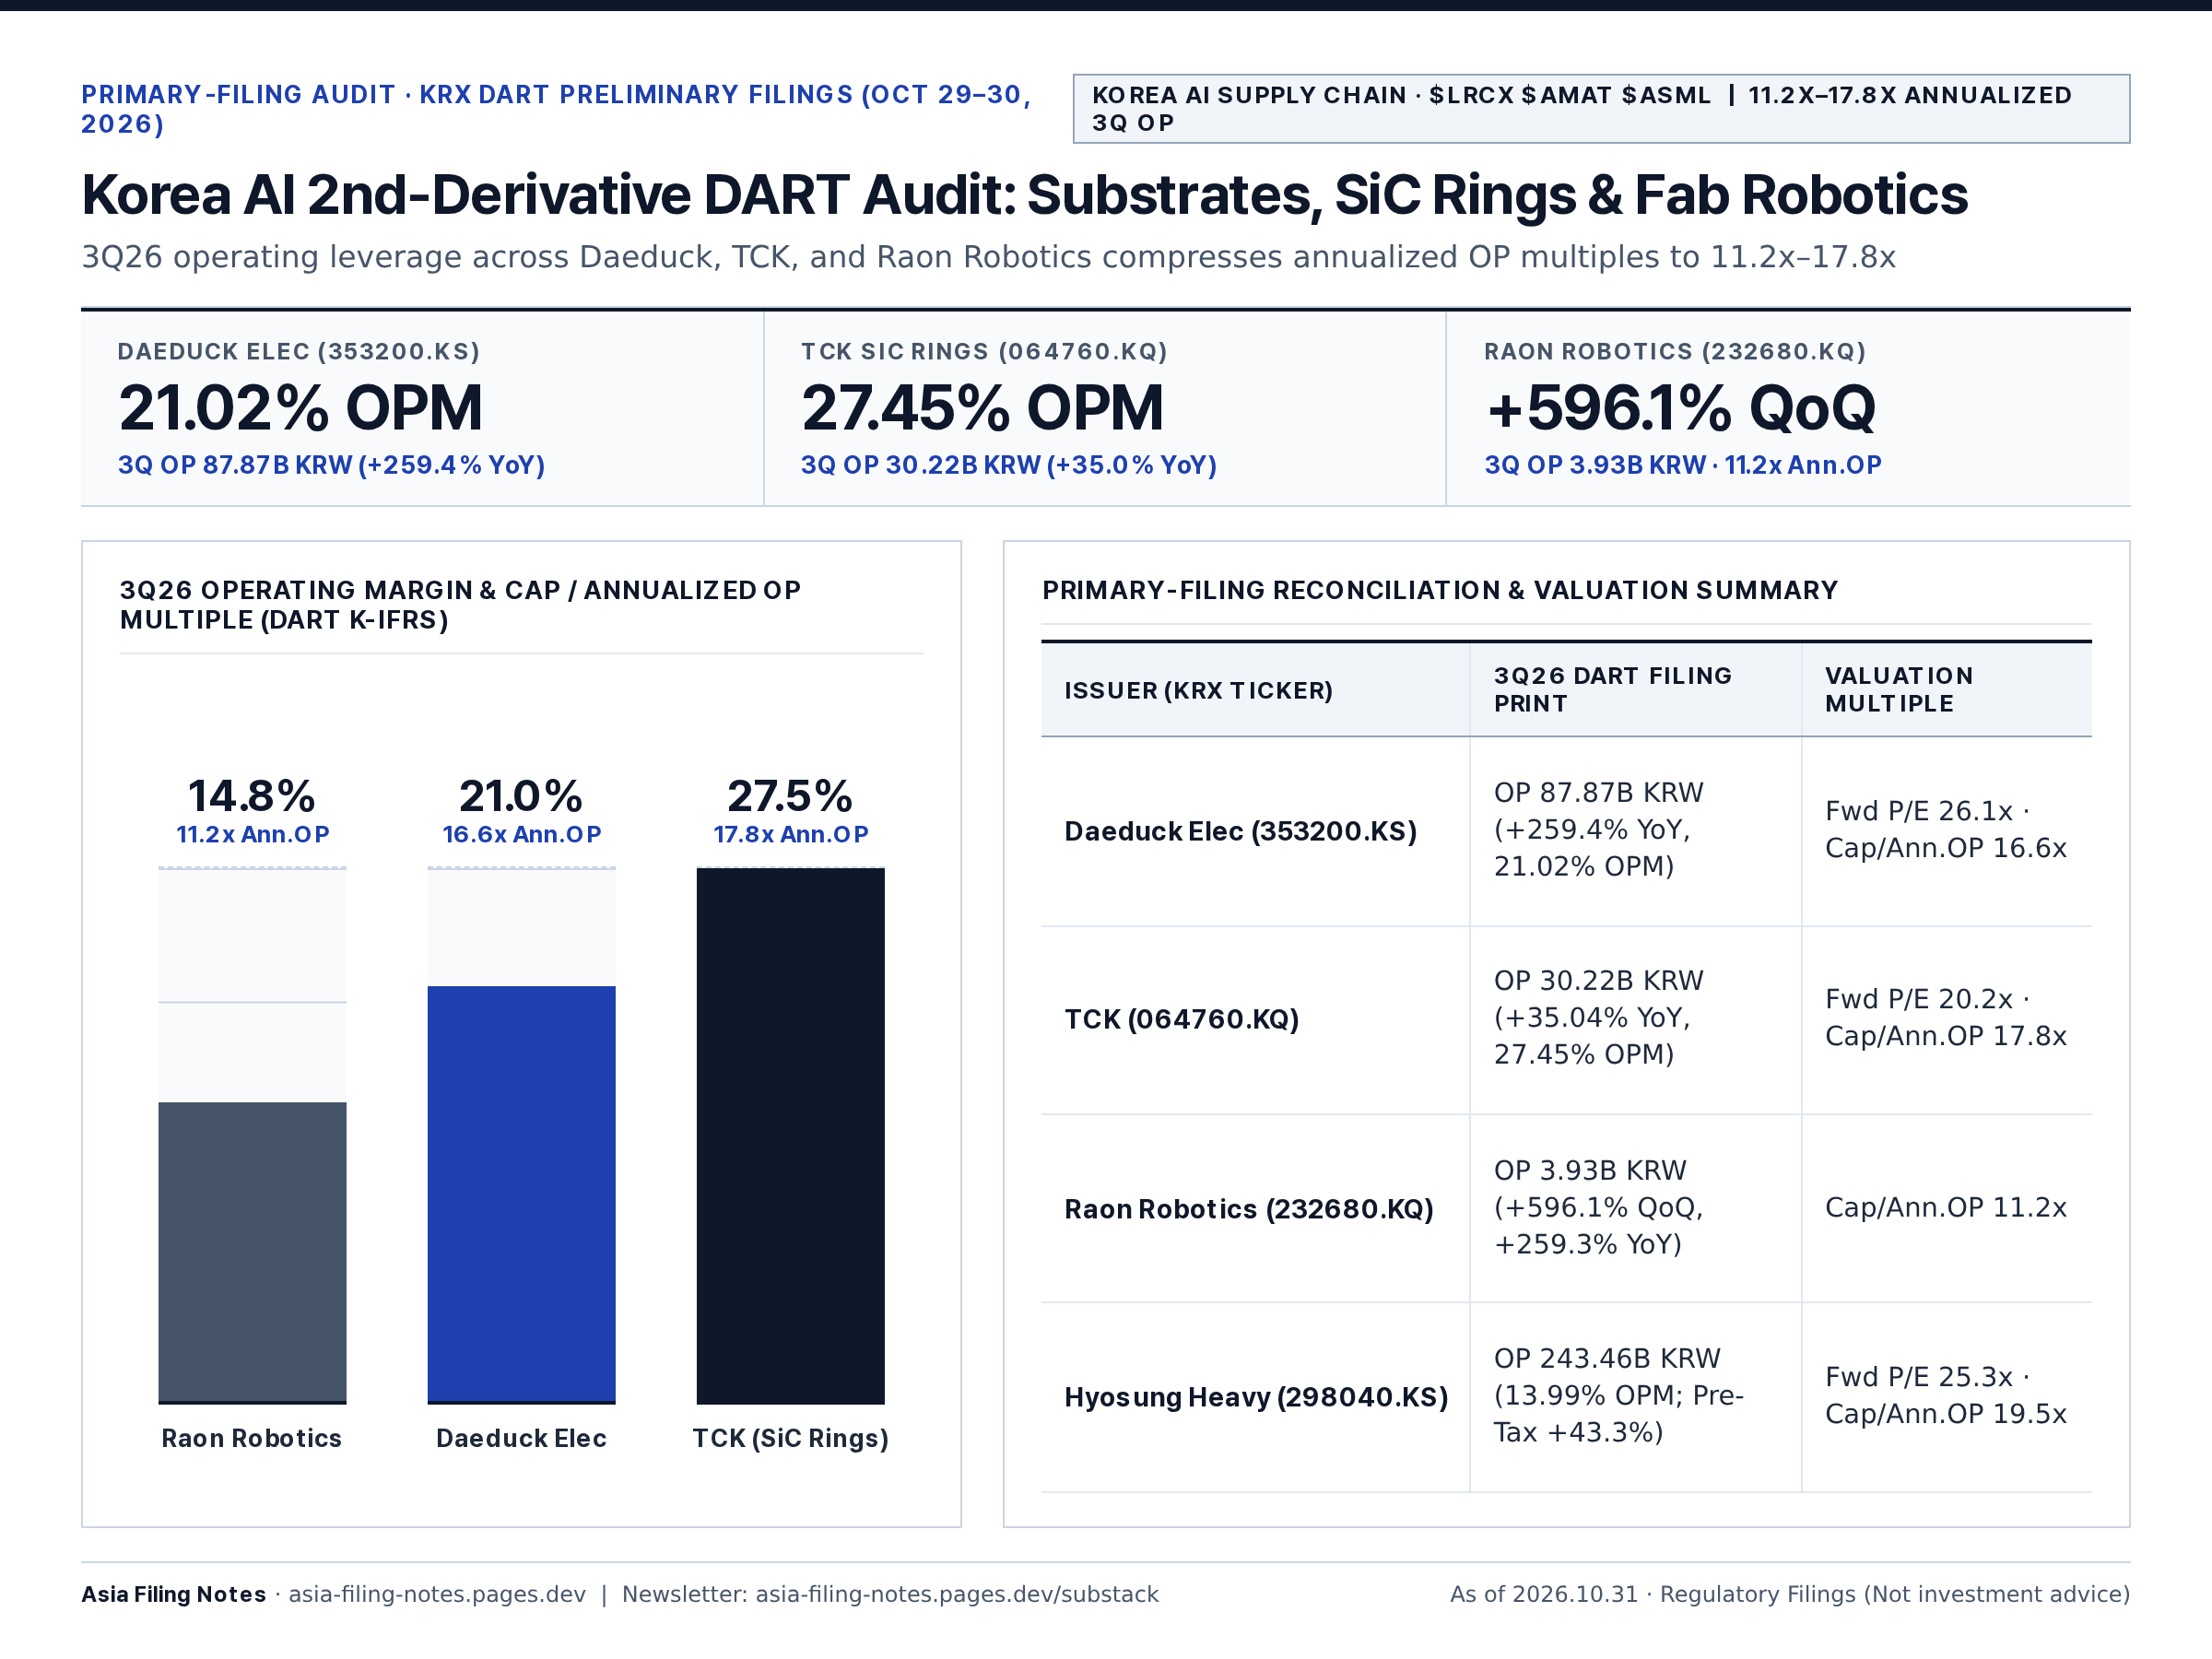
#03 · KOREA AI SUPPLY CHAIN · $LRCX $AMAT $ASML
11.2x–17.8x Annualized 3Q OP
Korea AI 2nd-Derivative DART Audit: Substrates, SiC Rings & Fab Robotics
FinTwit Vertical Bullet Post (247/280 chars · 100% English)
Korea AI supply-chain 3Q26 DART filings:

• #Daeduck (353200.KS): 21.0% OPM (+259% YoY OP, 16.6x Ann. OP)
• #TCK (064760.KQ): 27.5% OPM (17.8x Ann. OP)
• #RaonRobotics (232680.KQ): +596% QoQ OP (11.2x Ann. OP)

Fab tailwind with $LRCX $AMAT $ASML.
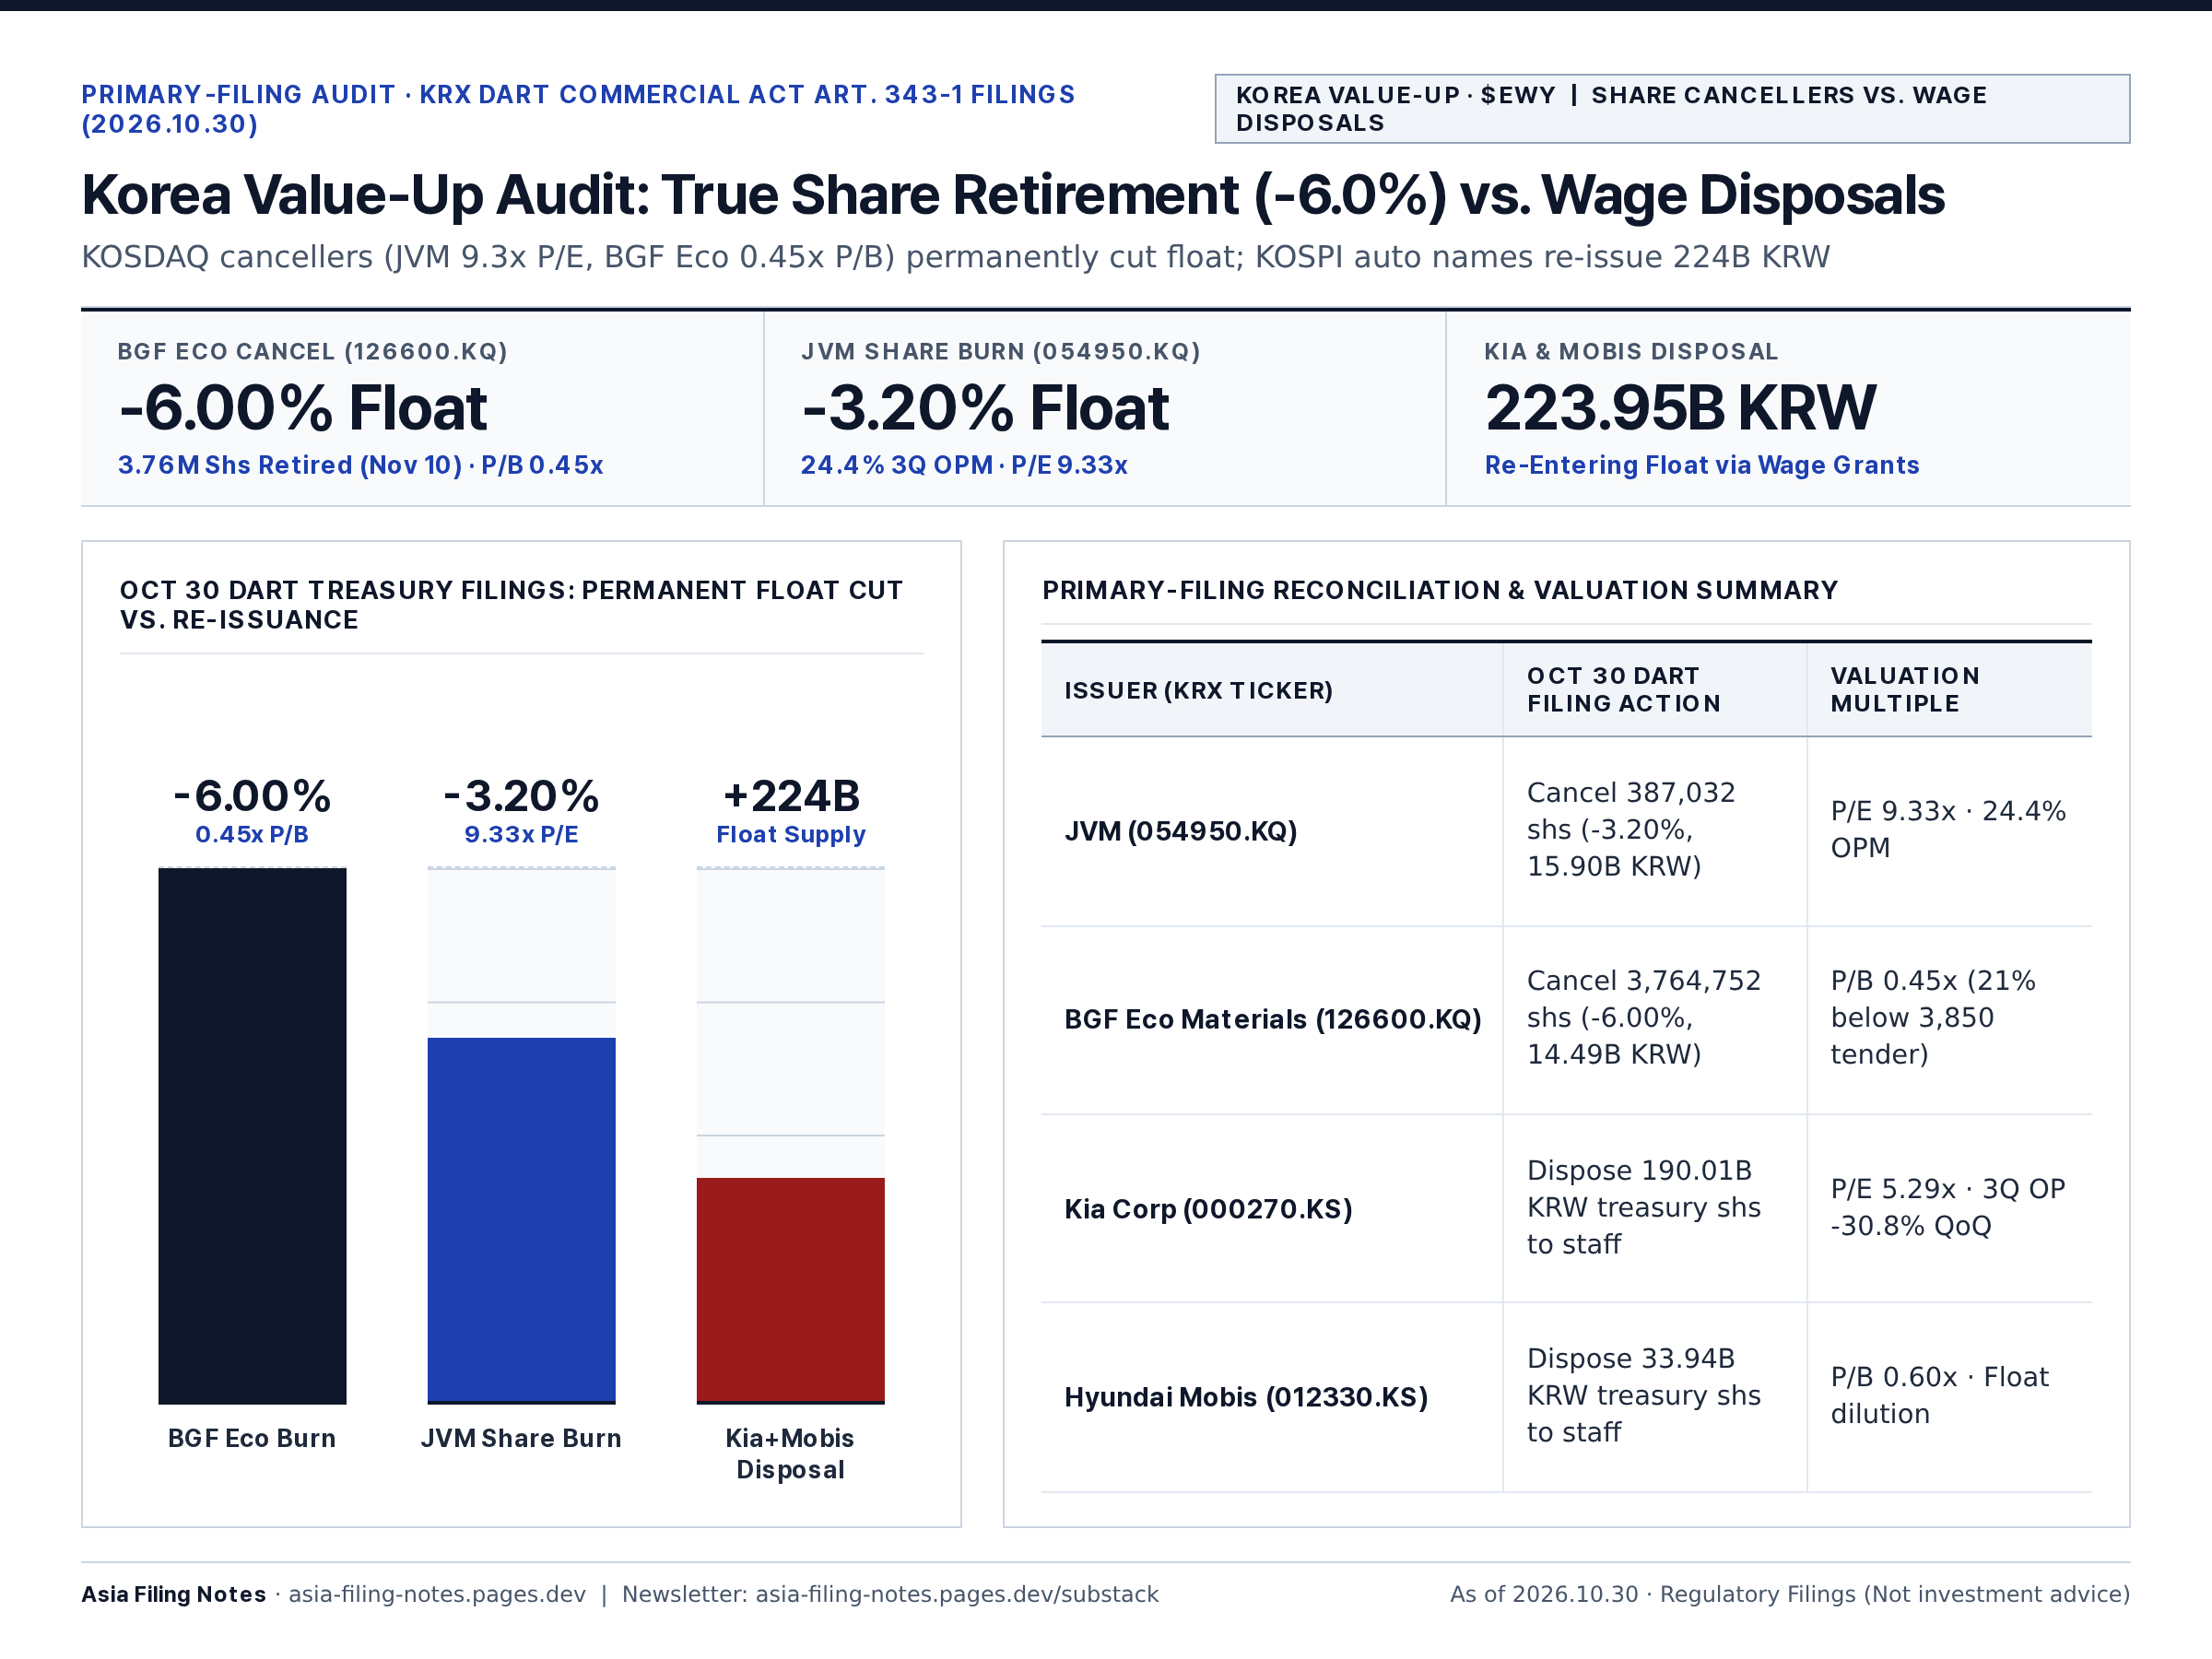
#04 · KOREA VALUE-UP · $EWY
Share Cancellers vs. Wage Disposals
Korea Value-Up Audit: True Share Retirement (-6.0%) vs. Wage Disposals
FinTwit Vertical Bullet Post (260/280 chars · 100% English)
Korea Value-Up DART audit: Share burn vs. wage disposal:

• #BGFEco (126600.KQ): -6.00% share burn (0.45x P/B)
• #JVM (054950.KQ): -3.20% share burn (9.33x P/E)
• #Kia ($KIMTF) & #HyundaiMobis: 223.95B KRW treasury shares re-issued

Governance filter for $EWY.
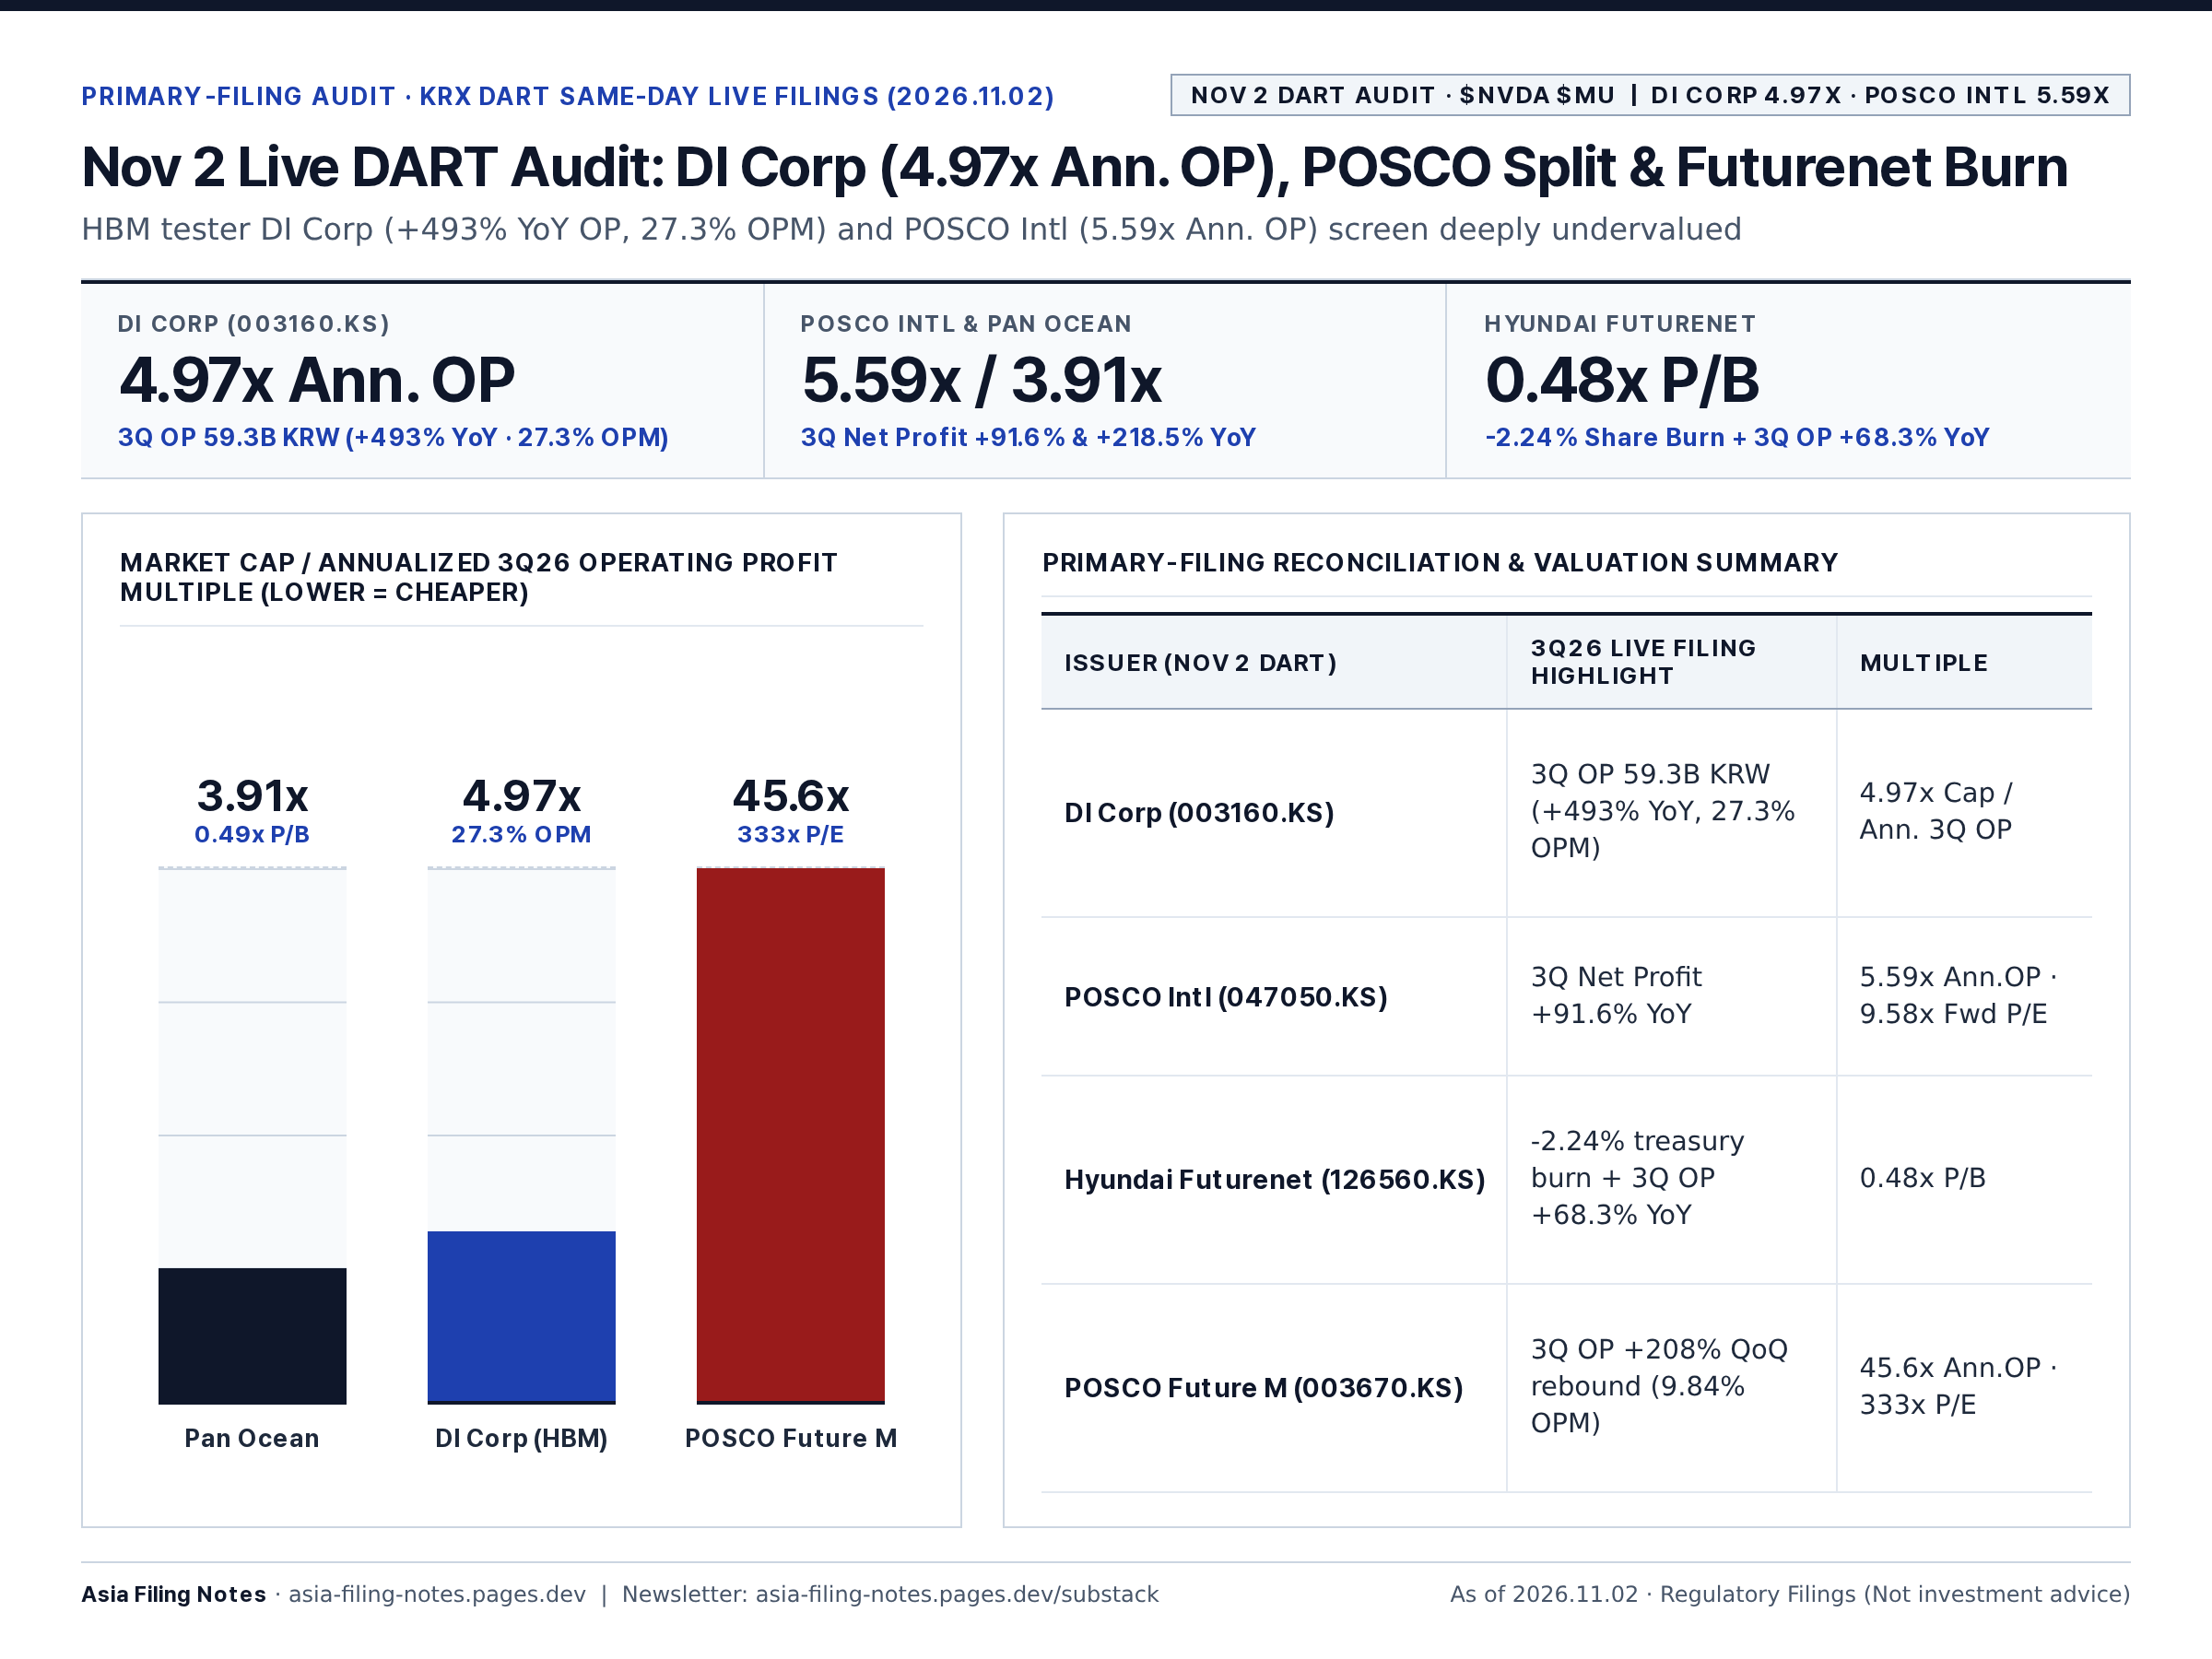
#05 · NOV 2 DART AUDIT · $NVDA $MU
DI Corp 4.97x · POSCO Intl 5.59x
Nov 2 Live DART Audit: DI Corp (4.97x Ann. OP), POSCO Split & Futurenet Burn
FinTwit Vertical Bullet Post (241/280 chars · 100% English)
Nov 2 KRX live DART earnings & buyback audit:

• #DICorp (003160.KS, HBM tester): 3Q OP +493% YoY (4.97x Ann. OP)
• #POSCOIntl (047050.KS): 3Q net +91.6% YoY (5.59x Ann. OP)
• #HyundaiFuturenet: -2.24% burn (0.48x P/B)

$HXSCL $NVDA $MU $EWY
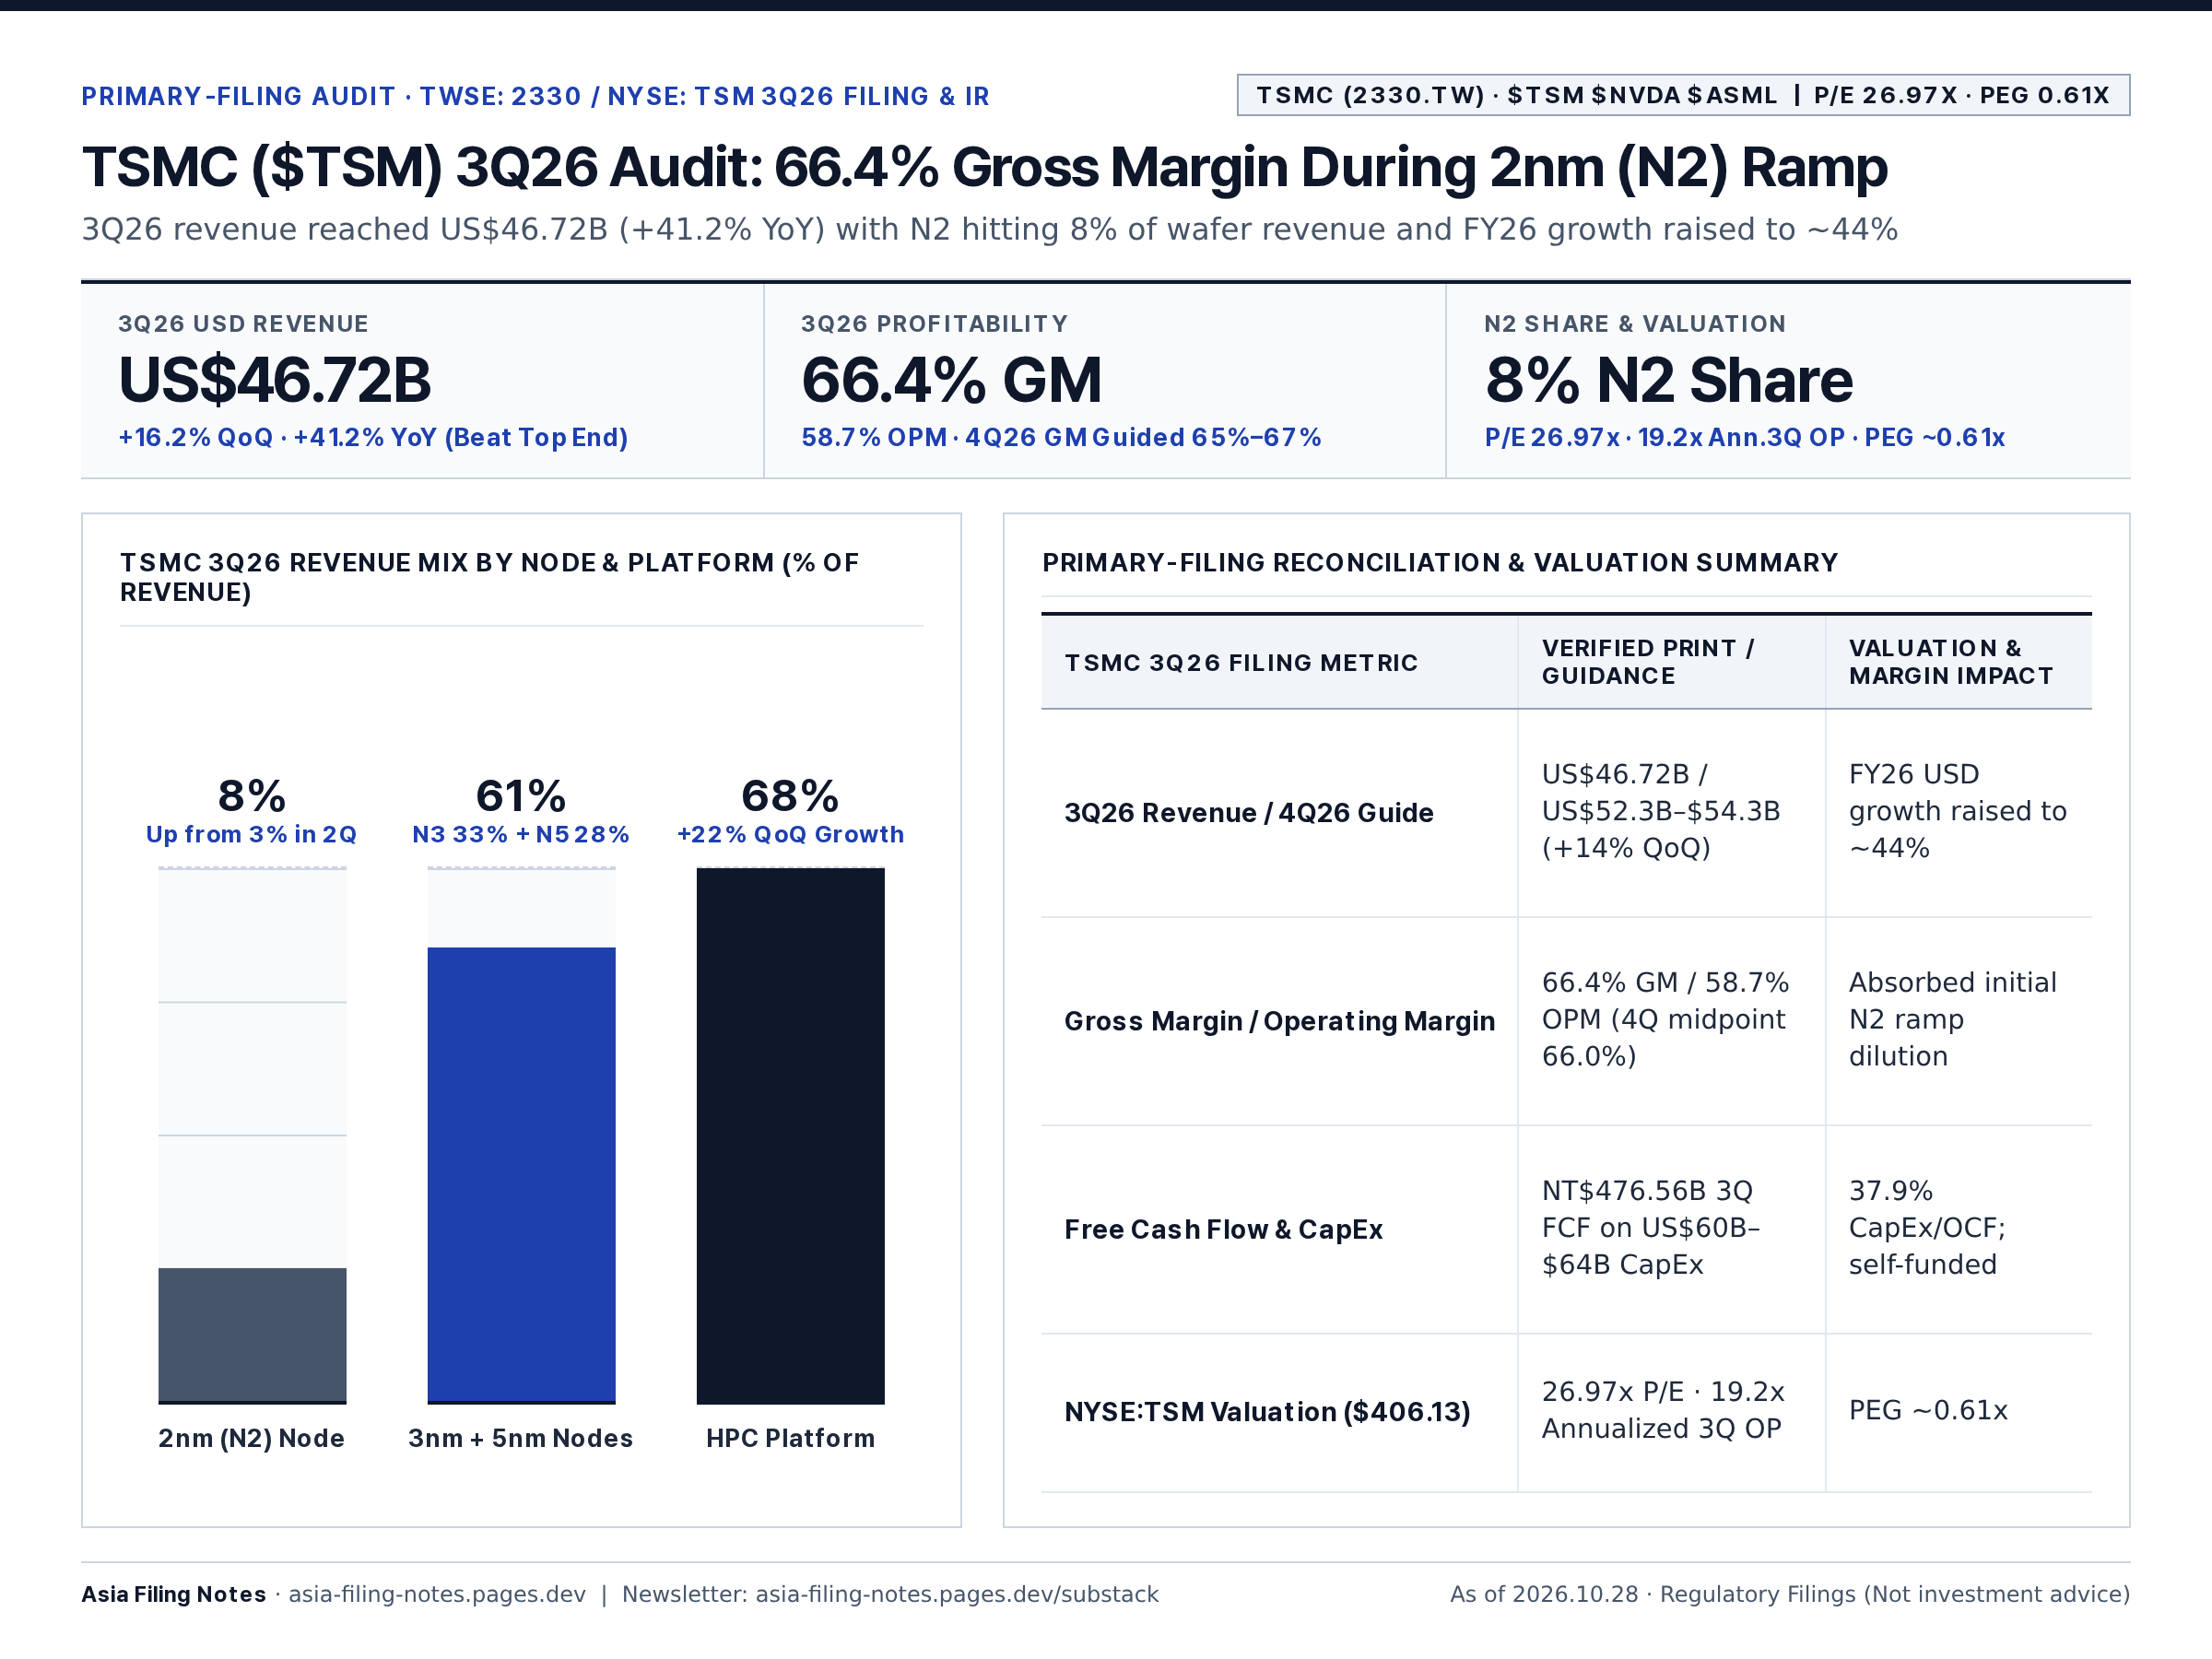
#06 · TSMC (2330.TW) · $TSM $NVDA $ASML
P/E 26.97x · PEG 0.61x
TSMC ($TSM) 3Q26 Audit: 66.4% Gross Margin During 2nm (N2) Ramp
FinTwit Vertical Bullet Post (235/280 chars · 100% English)
$TSM TSMC (2330.TW) 3Q26 filing audit:

• Revenue: $46.72B (+16.2% QoQ, +41.2% YoY)
• Margins: 66.4% GM, 58.7% OPM
• 2nm (N2) Share: 8% of wafer rev (vs 3% in 2Q)
• Valuation: 26.97x P/E (~0.61x PEG)

Core foundry for $NVDA $AVGO $AMD.
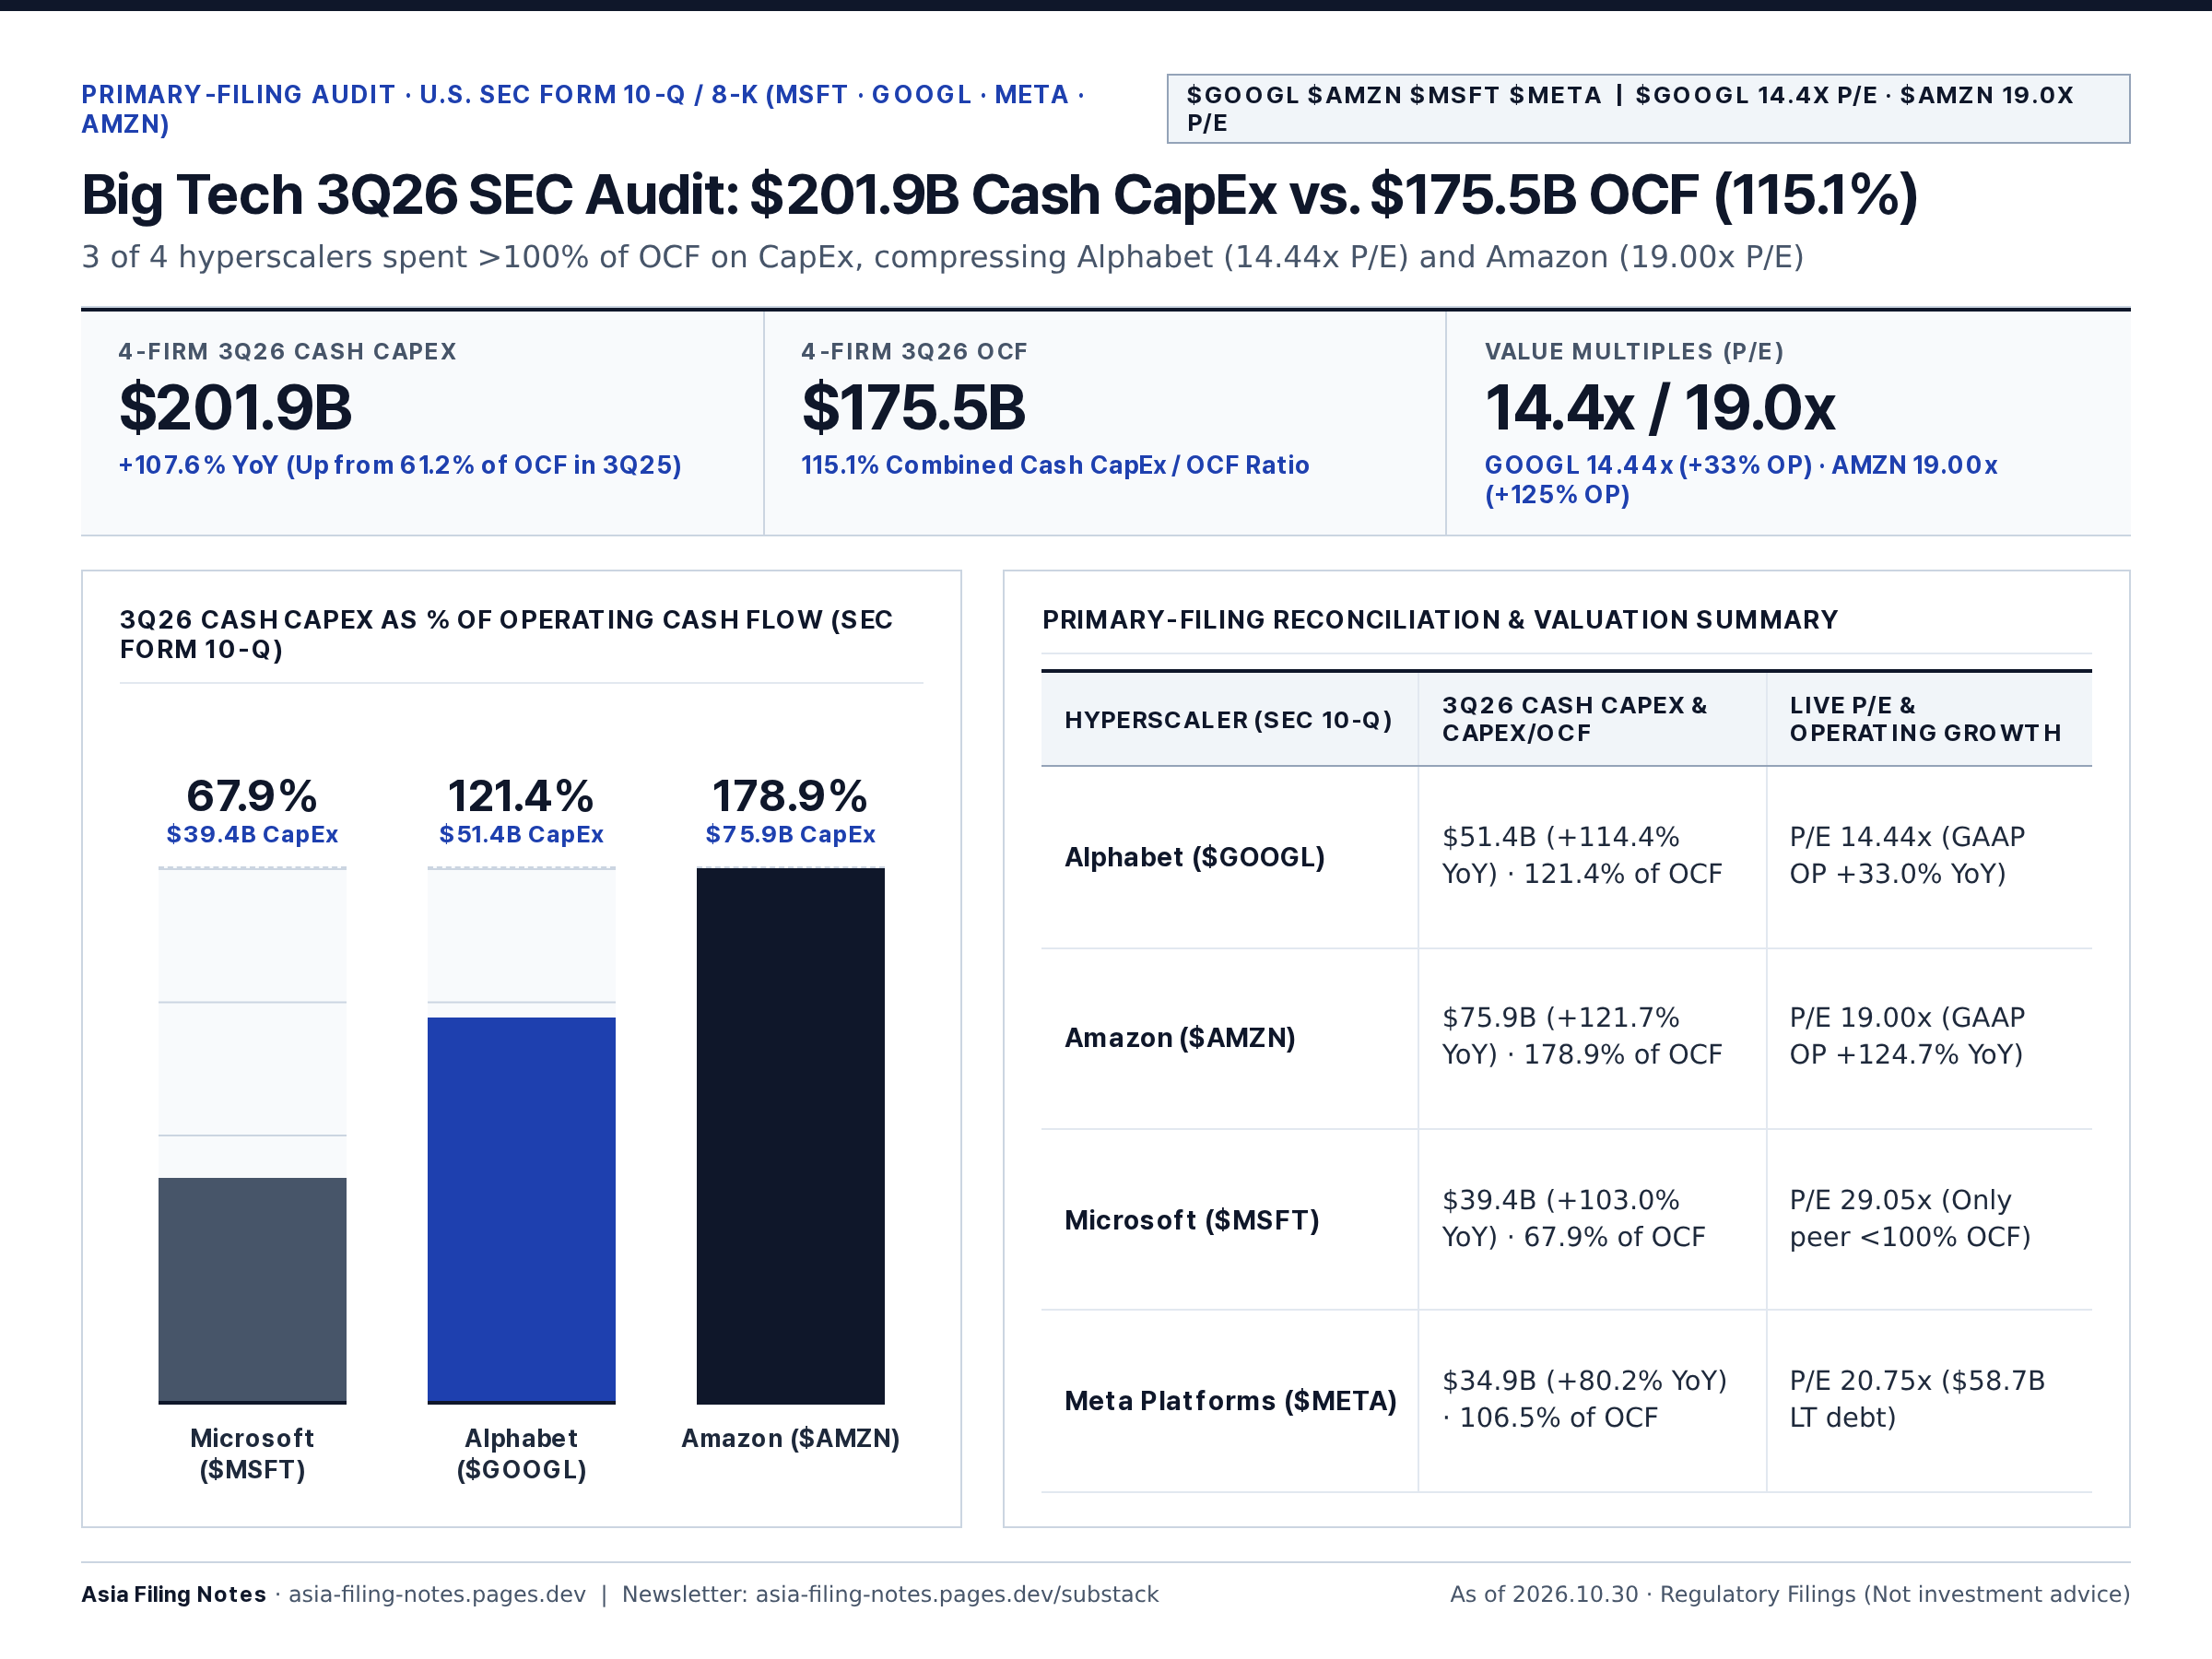
#07 · $GOOGL $AMZN $MSFT $META
$GOOGL 14.4x P/E · $AMZN 19.0x P/E
Big Tech 3Q26 SEC Audit: $201.9B Cash CapEx vs. $175.5B OCF (115.1%)
FinTwit Vertical Bullet Post (229/280 chars · 100% English)
Big Tech 3Q26 10-Q CapEx vs. Operating Cash Flow:

• Combined CapEx: $201.9B (+108% YoY, 115.1% of OCF)
• $AMZN: 178.9% of OCF (19.0x P/E)
• $GOOGL: 121.4% of OCF (14.4x P/E)
• $MSFT: 67.9% (29.1x P/E) | $META: 106.5% (20.8x P/E)
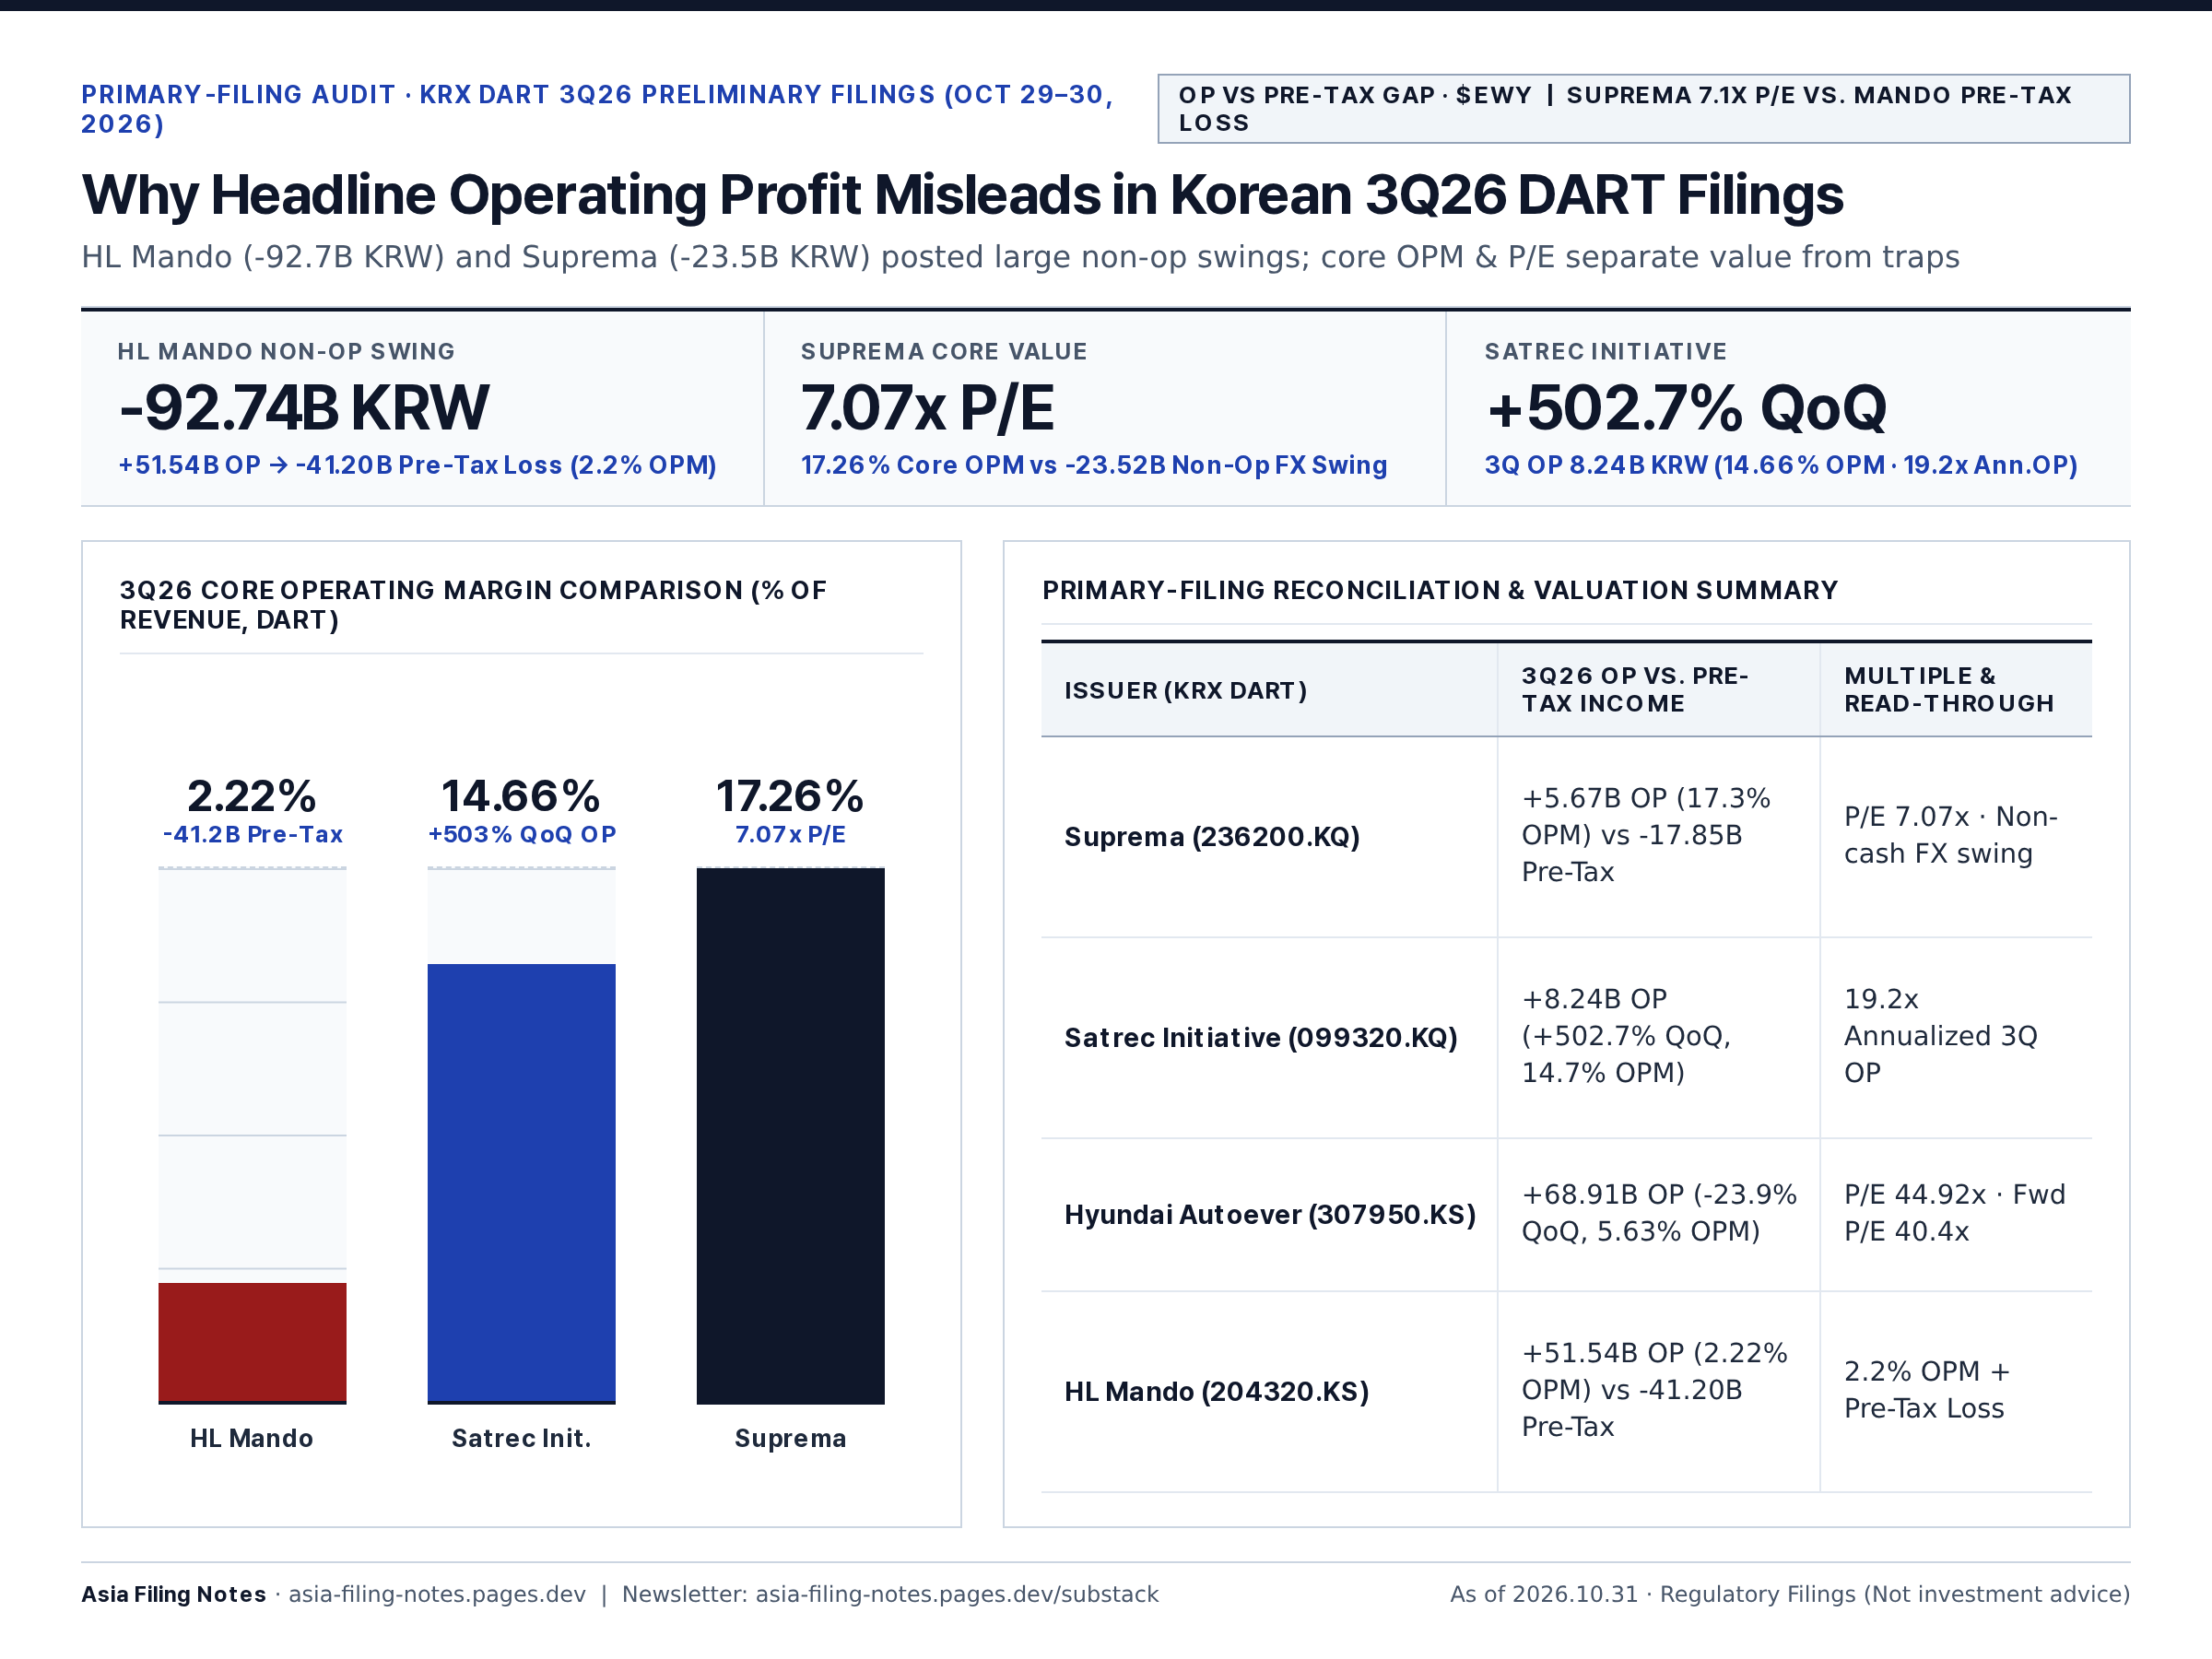
#08 · OP vs PRE-TAX GAP · $EWY
Suprema 7.1x P/E vs. Mando Pre-Tax Loss
Why Headline Operating Profit Misleads in Korean 3Q26 DART Filings
FinTwit Vertical Bullet Post (226/280 chars · 100% English)
Why headline Operating Profit misleads in 3Q26 DART filings:

• #HLMando (204320.KS): +51.5B OP -> -41.2B Pre-Tax loss (2.2% OPM)
• #Suprema (236200.KQ): 17.3% core OPM at 7.07x P/E
• #Satrec (099320.KQ): 3Q OP +503% QoQ

$EWY
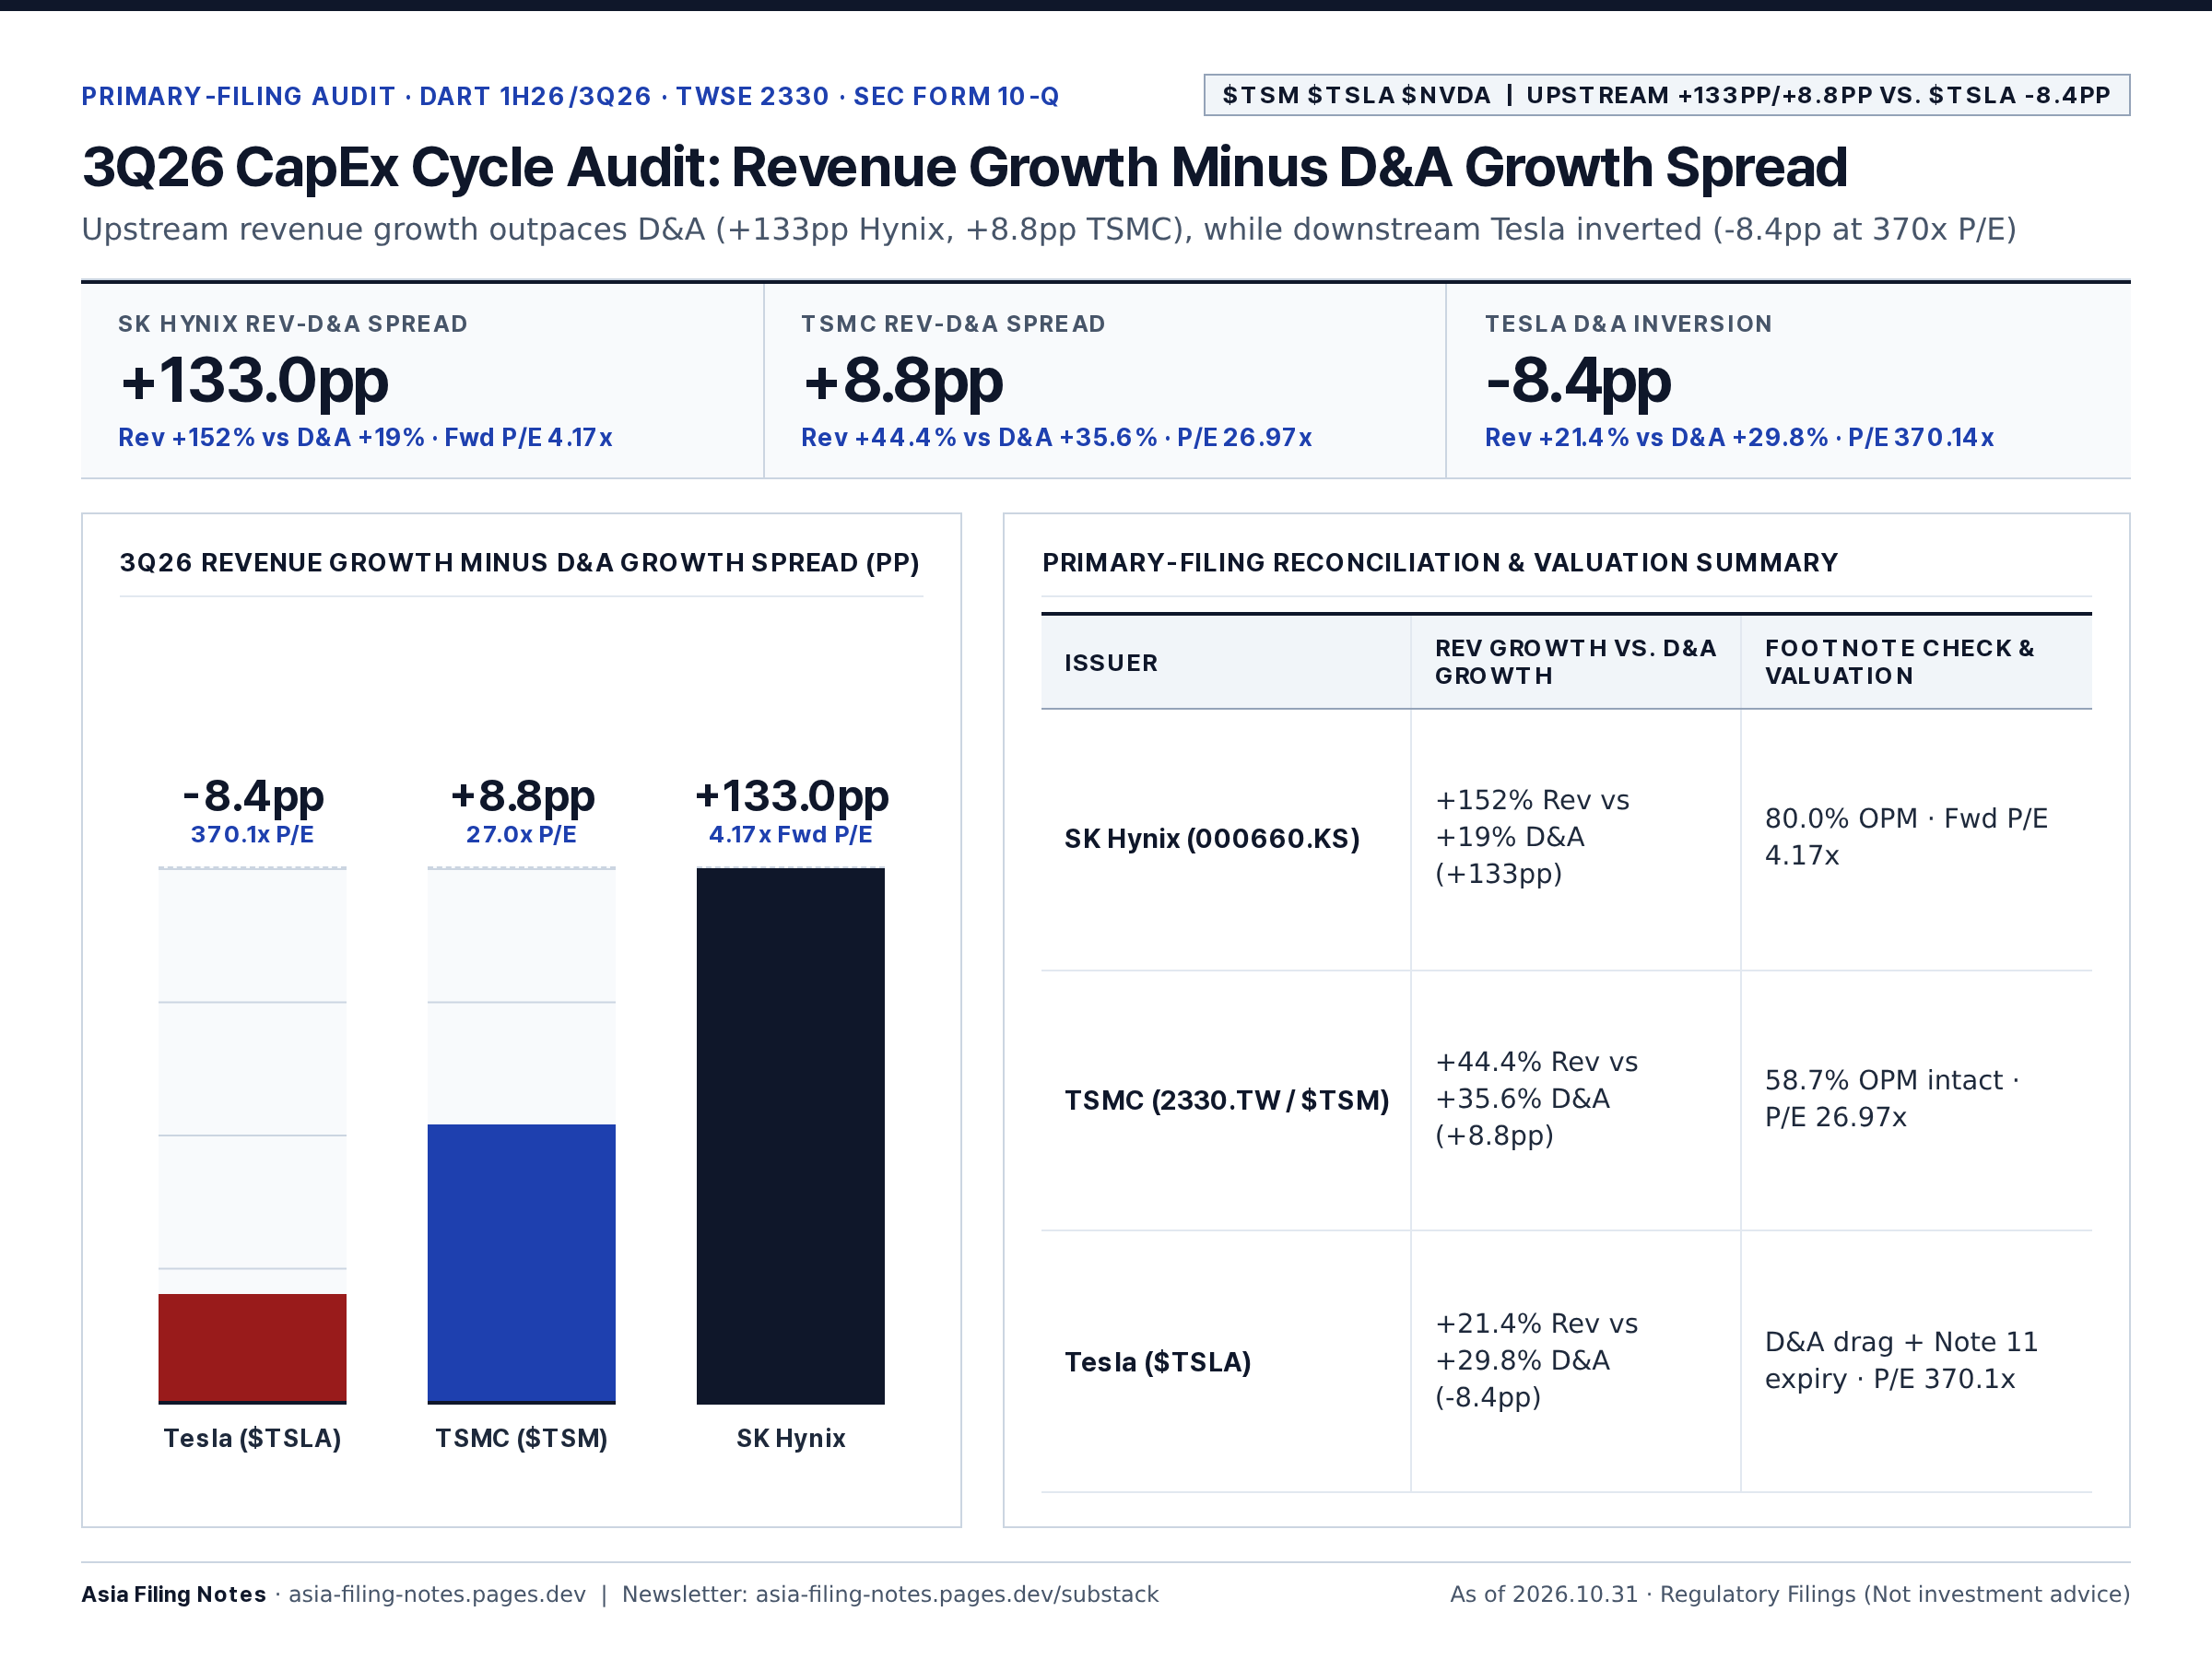
#09 · $TSM $TSLA $NVDA
Upstream +133pp/+8.8pp vs. $TSLA -8.4pp
3Q26 CapEx Cycle Audit: Revenue Growth Minus D&A Growth Spread
FinTwit Vertical Bullet Post (228/280 chars · 100% English)
3Q26 CapEx Cycle Check (Rev Growth minus D&A Growth):

• #SKHynix ($HXSCL / 000660.KS): +133.0pp spread (4.17x Fwd P/E)
• $TSM: +8.8pp spread (27.0x P/E)
• $TSLA: -8.4pp inverted (Rev +21.4% vs D&A +29.8%, 370.1x P/E)

$NVDA $MU
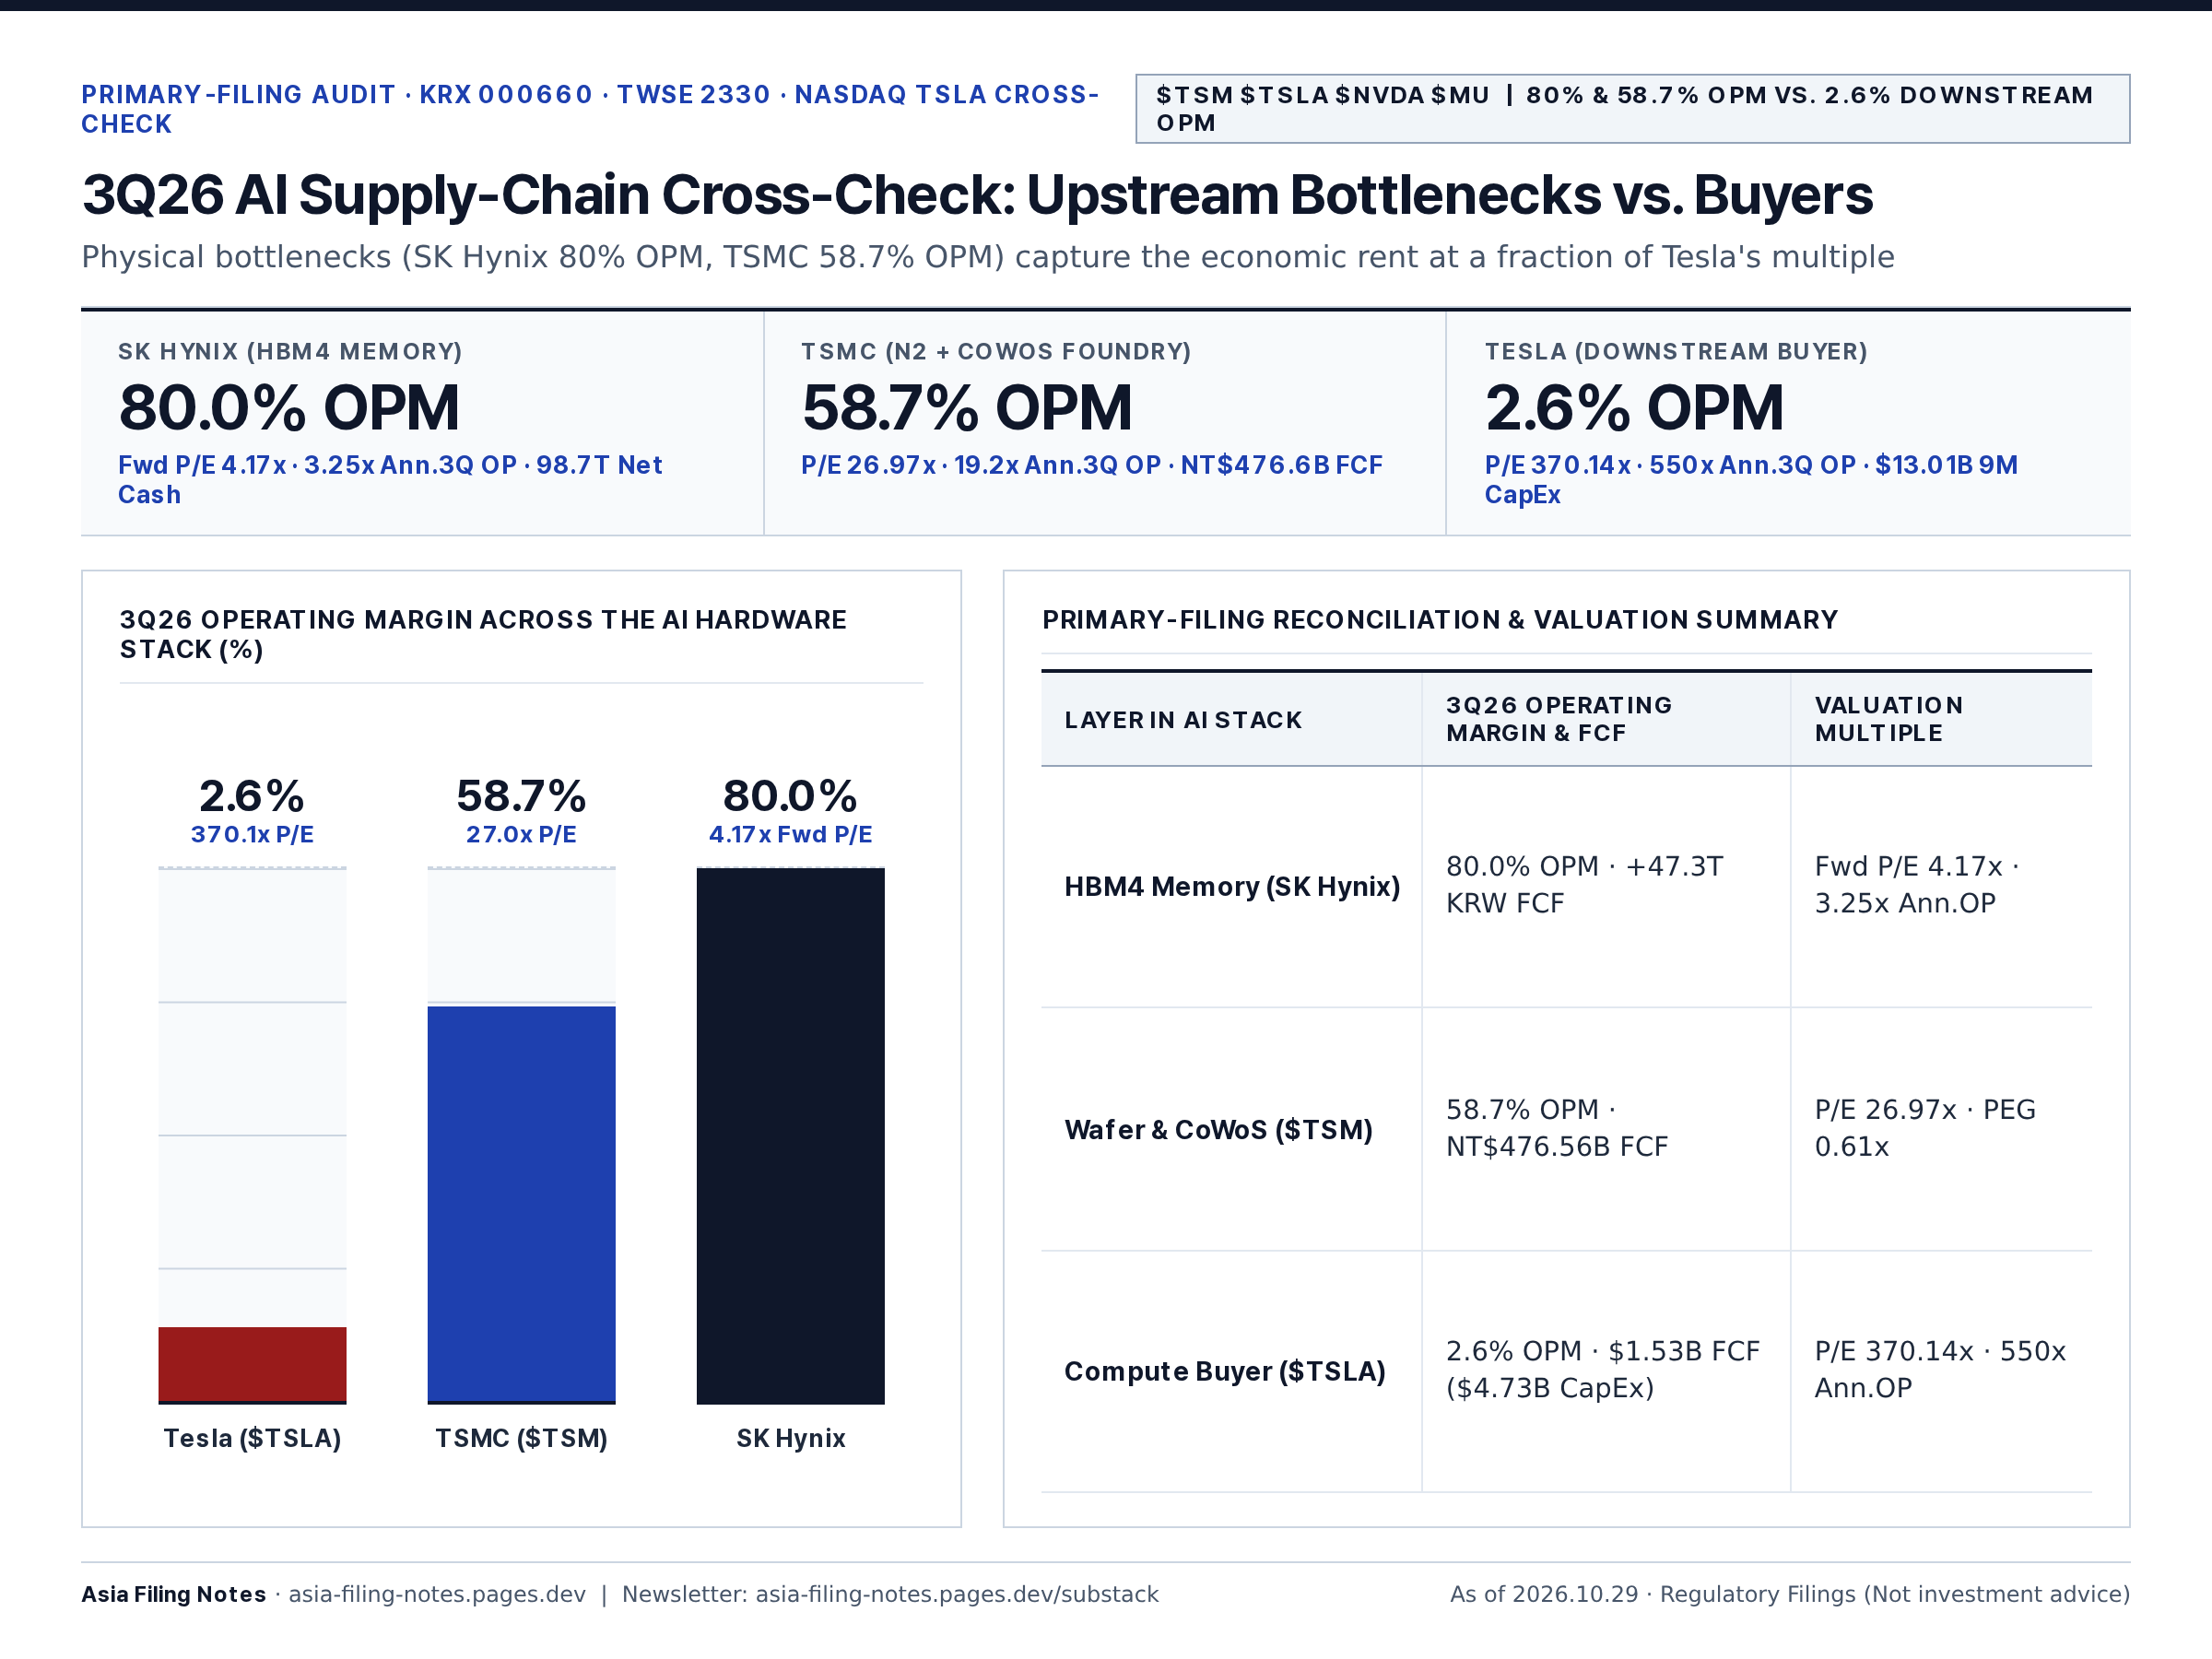
#10 · $TSM $TSLA $NVDA $MU
80% & 58.7% OPM vs. 2.6% Downstream OPM
3Q26 AI Supply-Chain Cross-Check: Upstream Bottlenecks vs. Buyers
FinTwit Vertical Bullet Post (253/280 chars · 100% English)
The 3Q26 AI Supply-Chain Valuation Paradox:

• #SKHynix ($HXSCL / 000660.KS): 80.0% OPM — 4.17x Fwd P/E
• $TSM: 58.7% OPM — 26.97x P/E (~0.61x PEG)
• $TSLA: 2.6% GAAP OPM — 370.14x P/E

Upstream bottlenecks ($HXSCL $TSM $NVDA $MU) capture the cash flow.
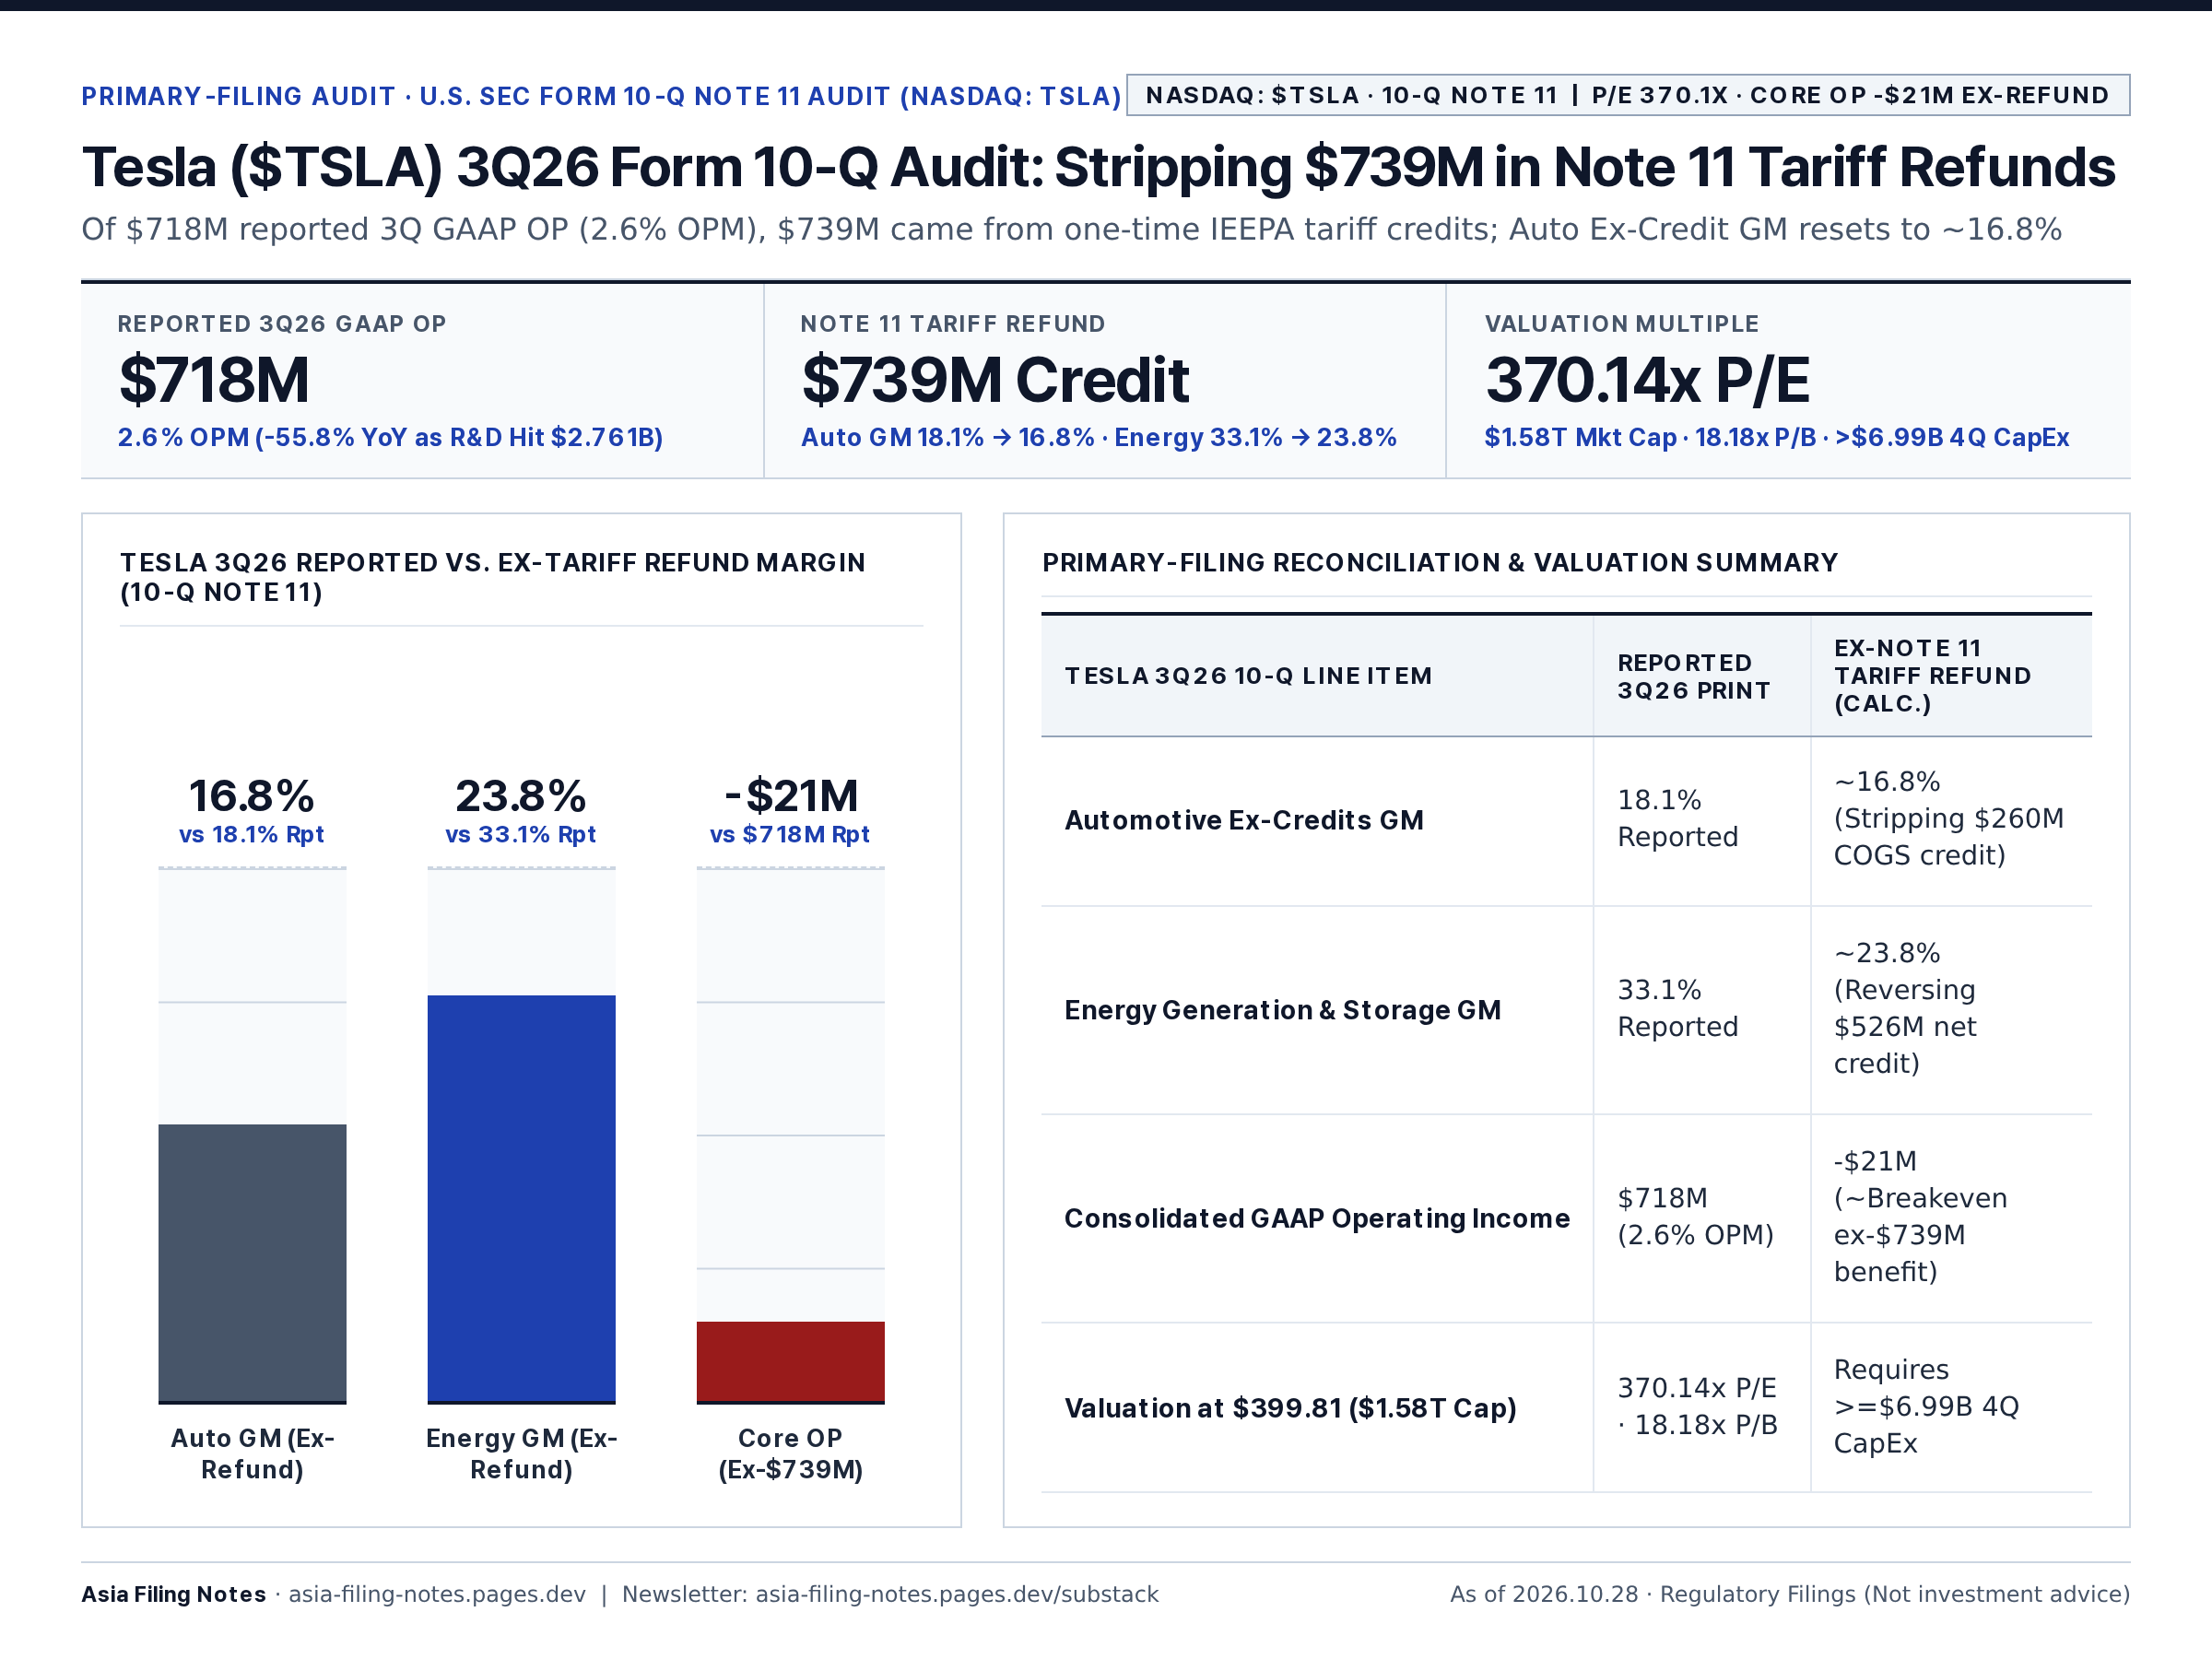
#11 · NASDAQ: $TSLA · 10-Q NOTE 11
P/E 370.1x · Core OP -$21M Ex-Refund
Tesla ($TSLA) 3Q26 Form 10-Q Audit: Stripping $739M in Note 11 Tariff Refunds
FinTwit Vertical Bullet Post (271/280 chars · 100% English)
$TSLA 3Q26 Form 10-Q Note 11 footnote audit:

• Reported GAAP OP: $718M (2.6% OPM)
• One-Time Note 11 IEEPA Tariff Refunds: $739M
• Auto Ex-Credit GM Ex-Refund: ~16.8% (vs 18.1% reported)
• Energy GM Ex-Refund: ~23.8% (vs 33.1% reported)

Core OP was -$21M at 370.1x P/E.
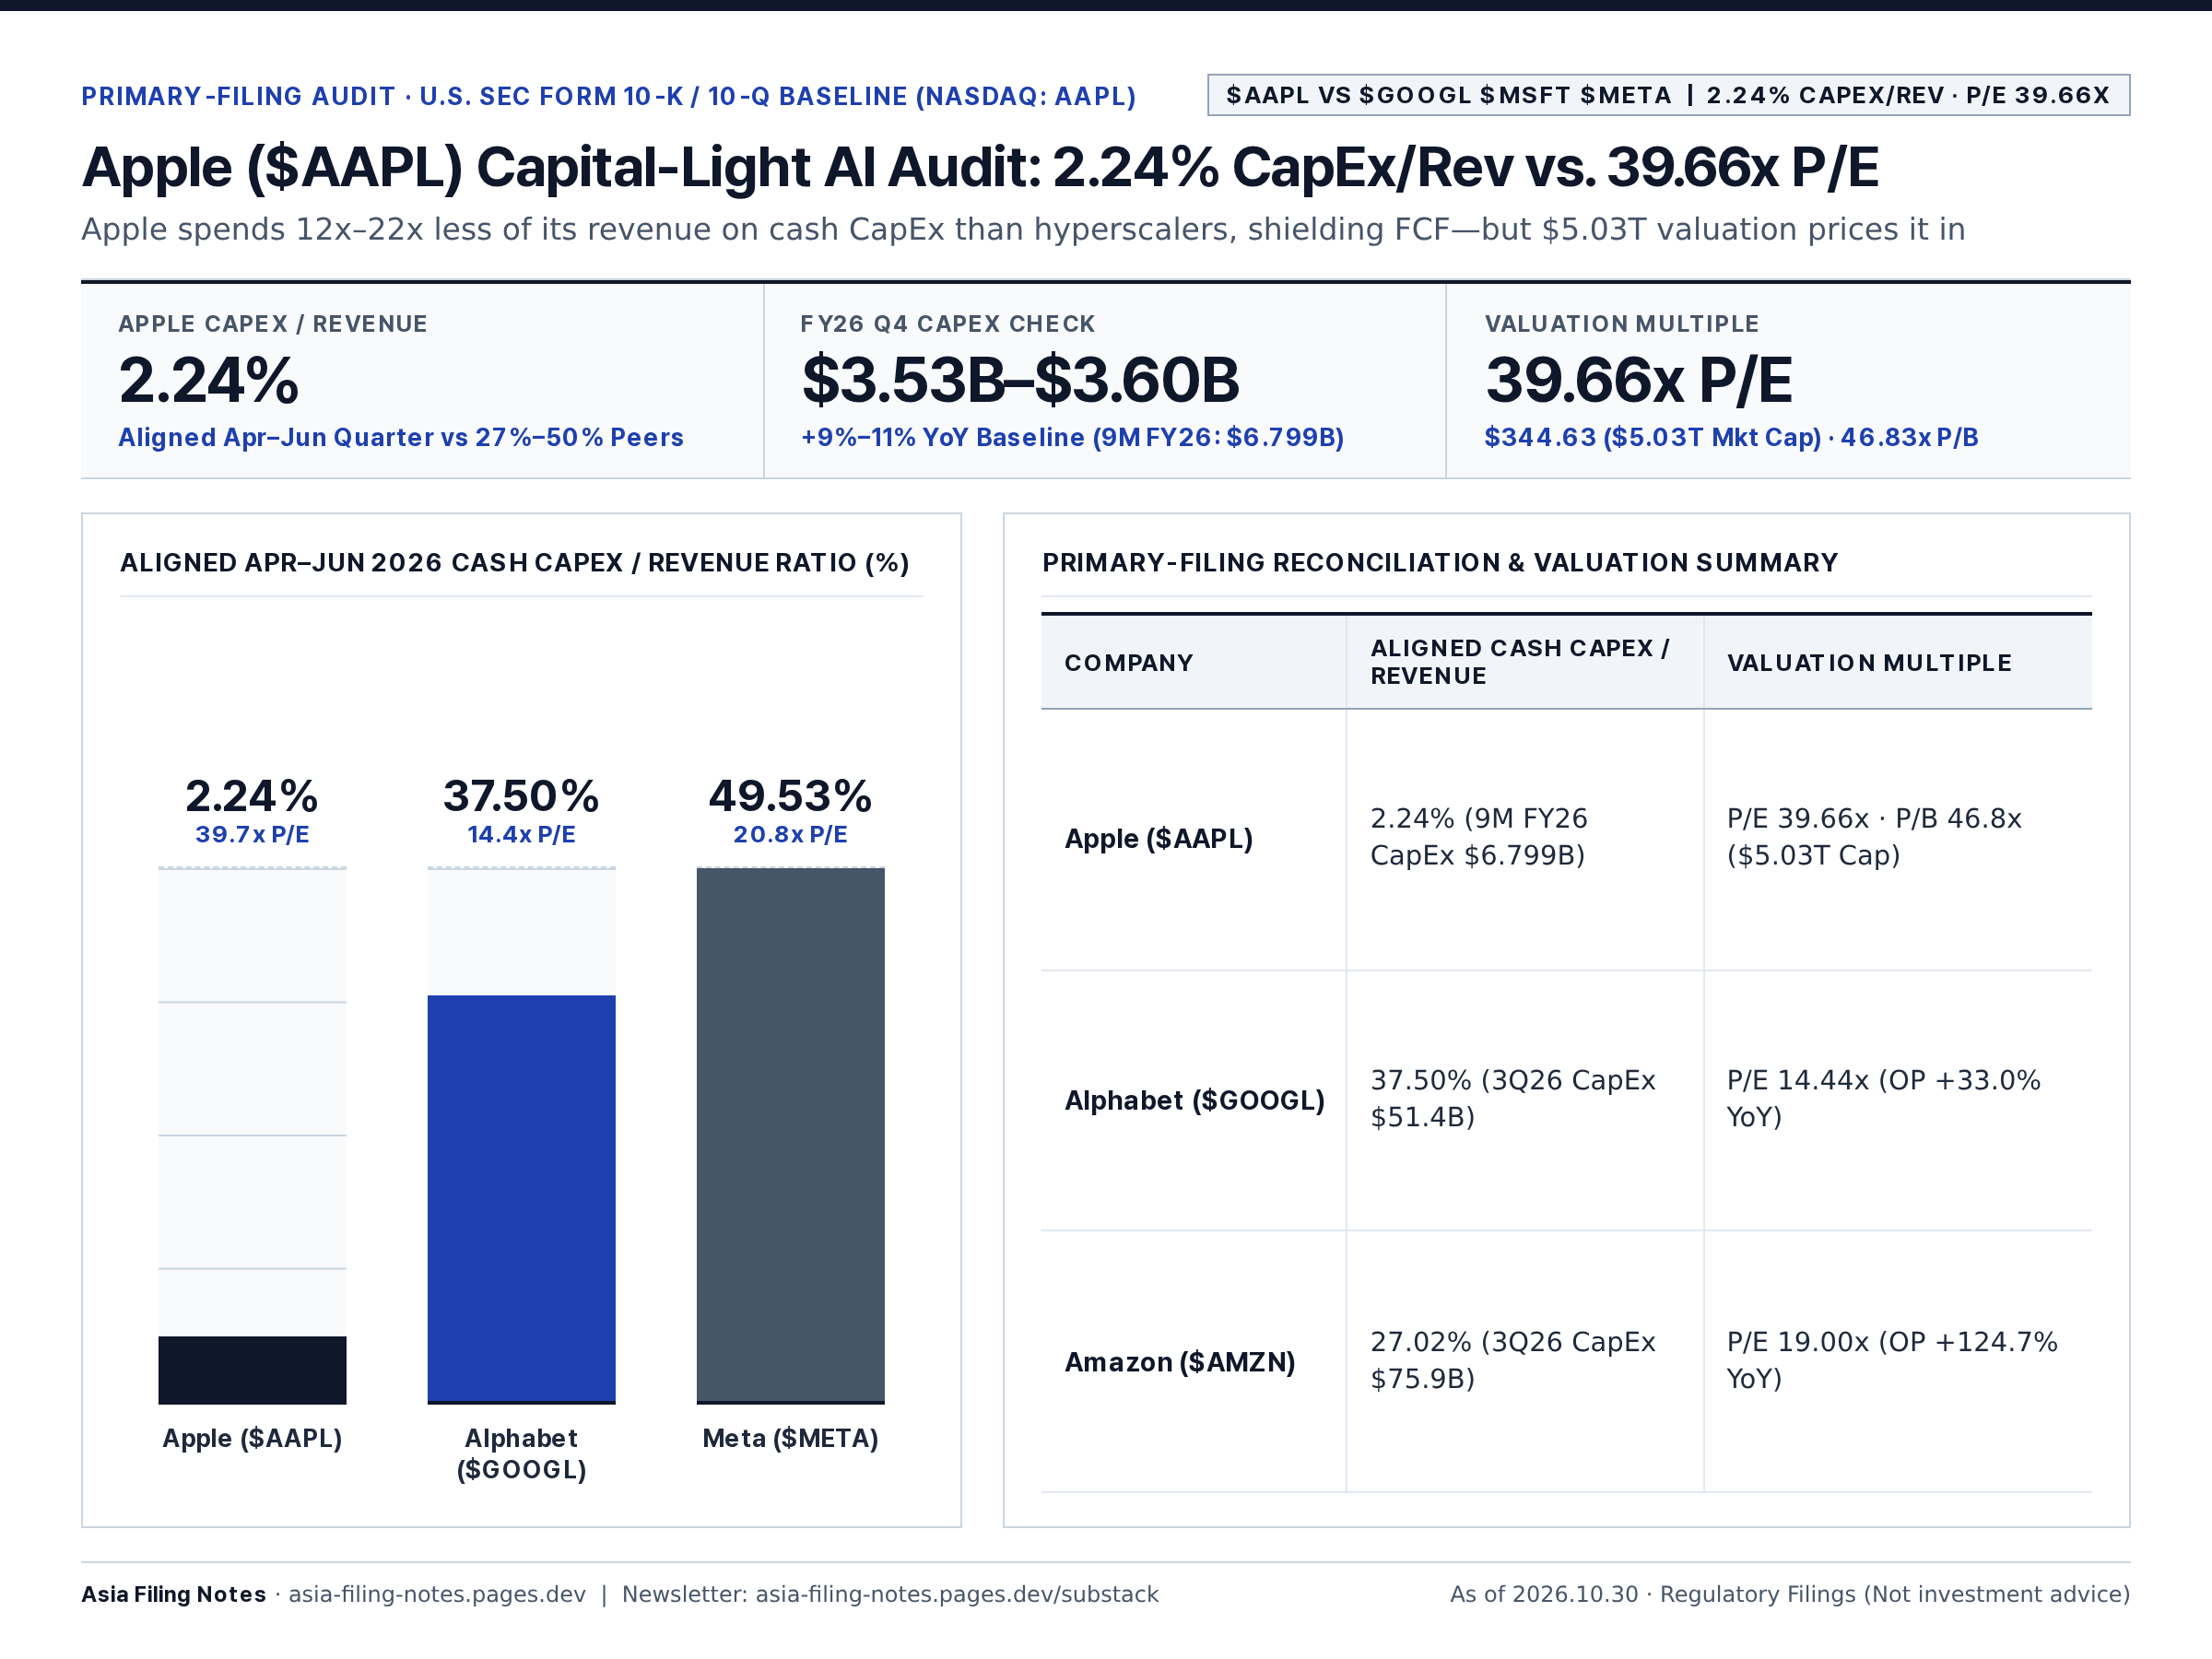
#12 · $AAPL vs $GOOGL $MSFT $META
2.24% CapEx/Rev · P/E 39.66x
Apple ($AAPL) Capital-Light AI Audit: 2.24% CapEx/Rev vs. 39.66x P/E
FinTwit Vertical Bullet Post (267/280 chars · 100% English)
$AAPL Capital-Light AI vs. Hyperscaler CapEx audit:

• $AAPL Cash CapEx/Rev: 2.24% (39.66x P/E, $5.03T cap)
• $AMZN CapEx/Rev: 27.02% (19.00x P/E)
• $GOOGL CapEx/Rev: 37.50% (14.44x P/E)
• $MSFT: 39.78% | $META: 49.53%

Apple's FCF shield is fully priced at ~40x P/E.
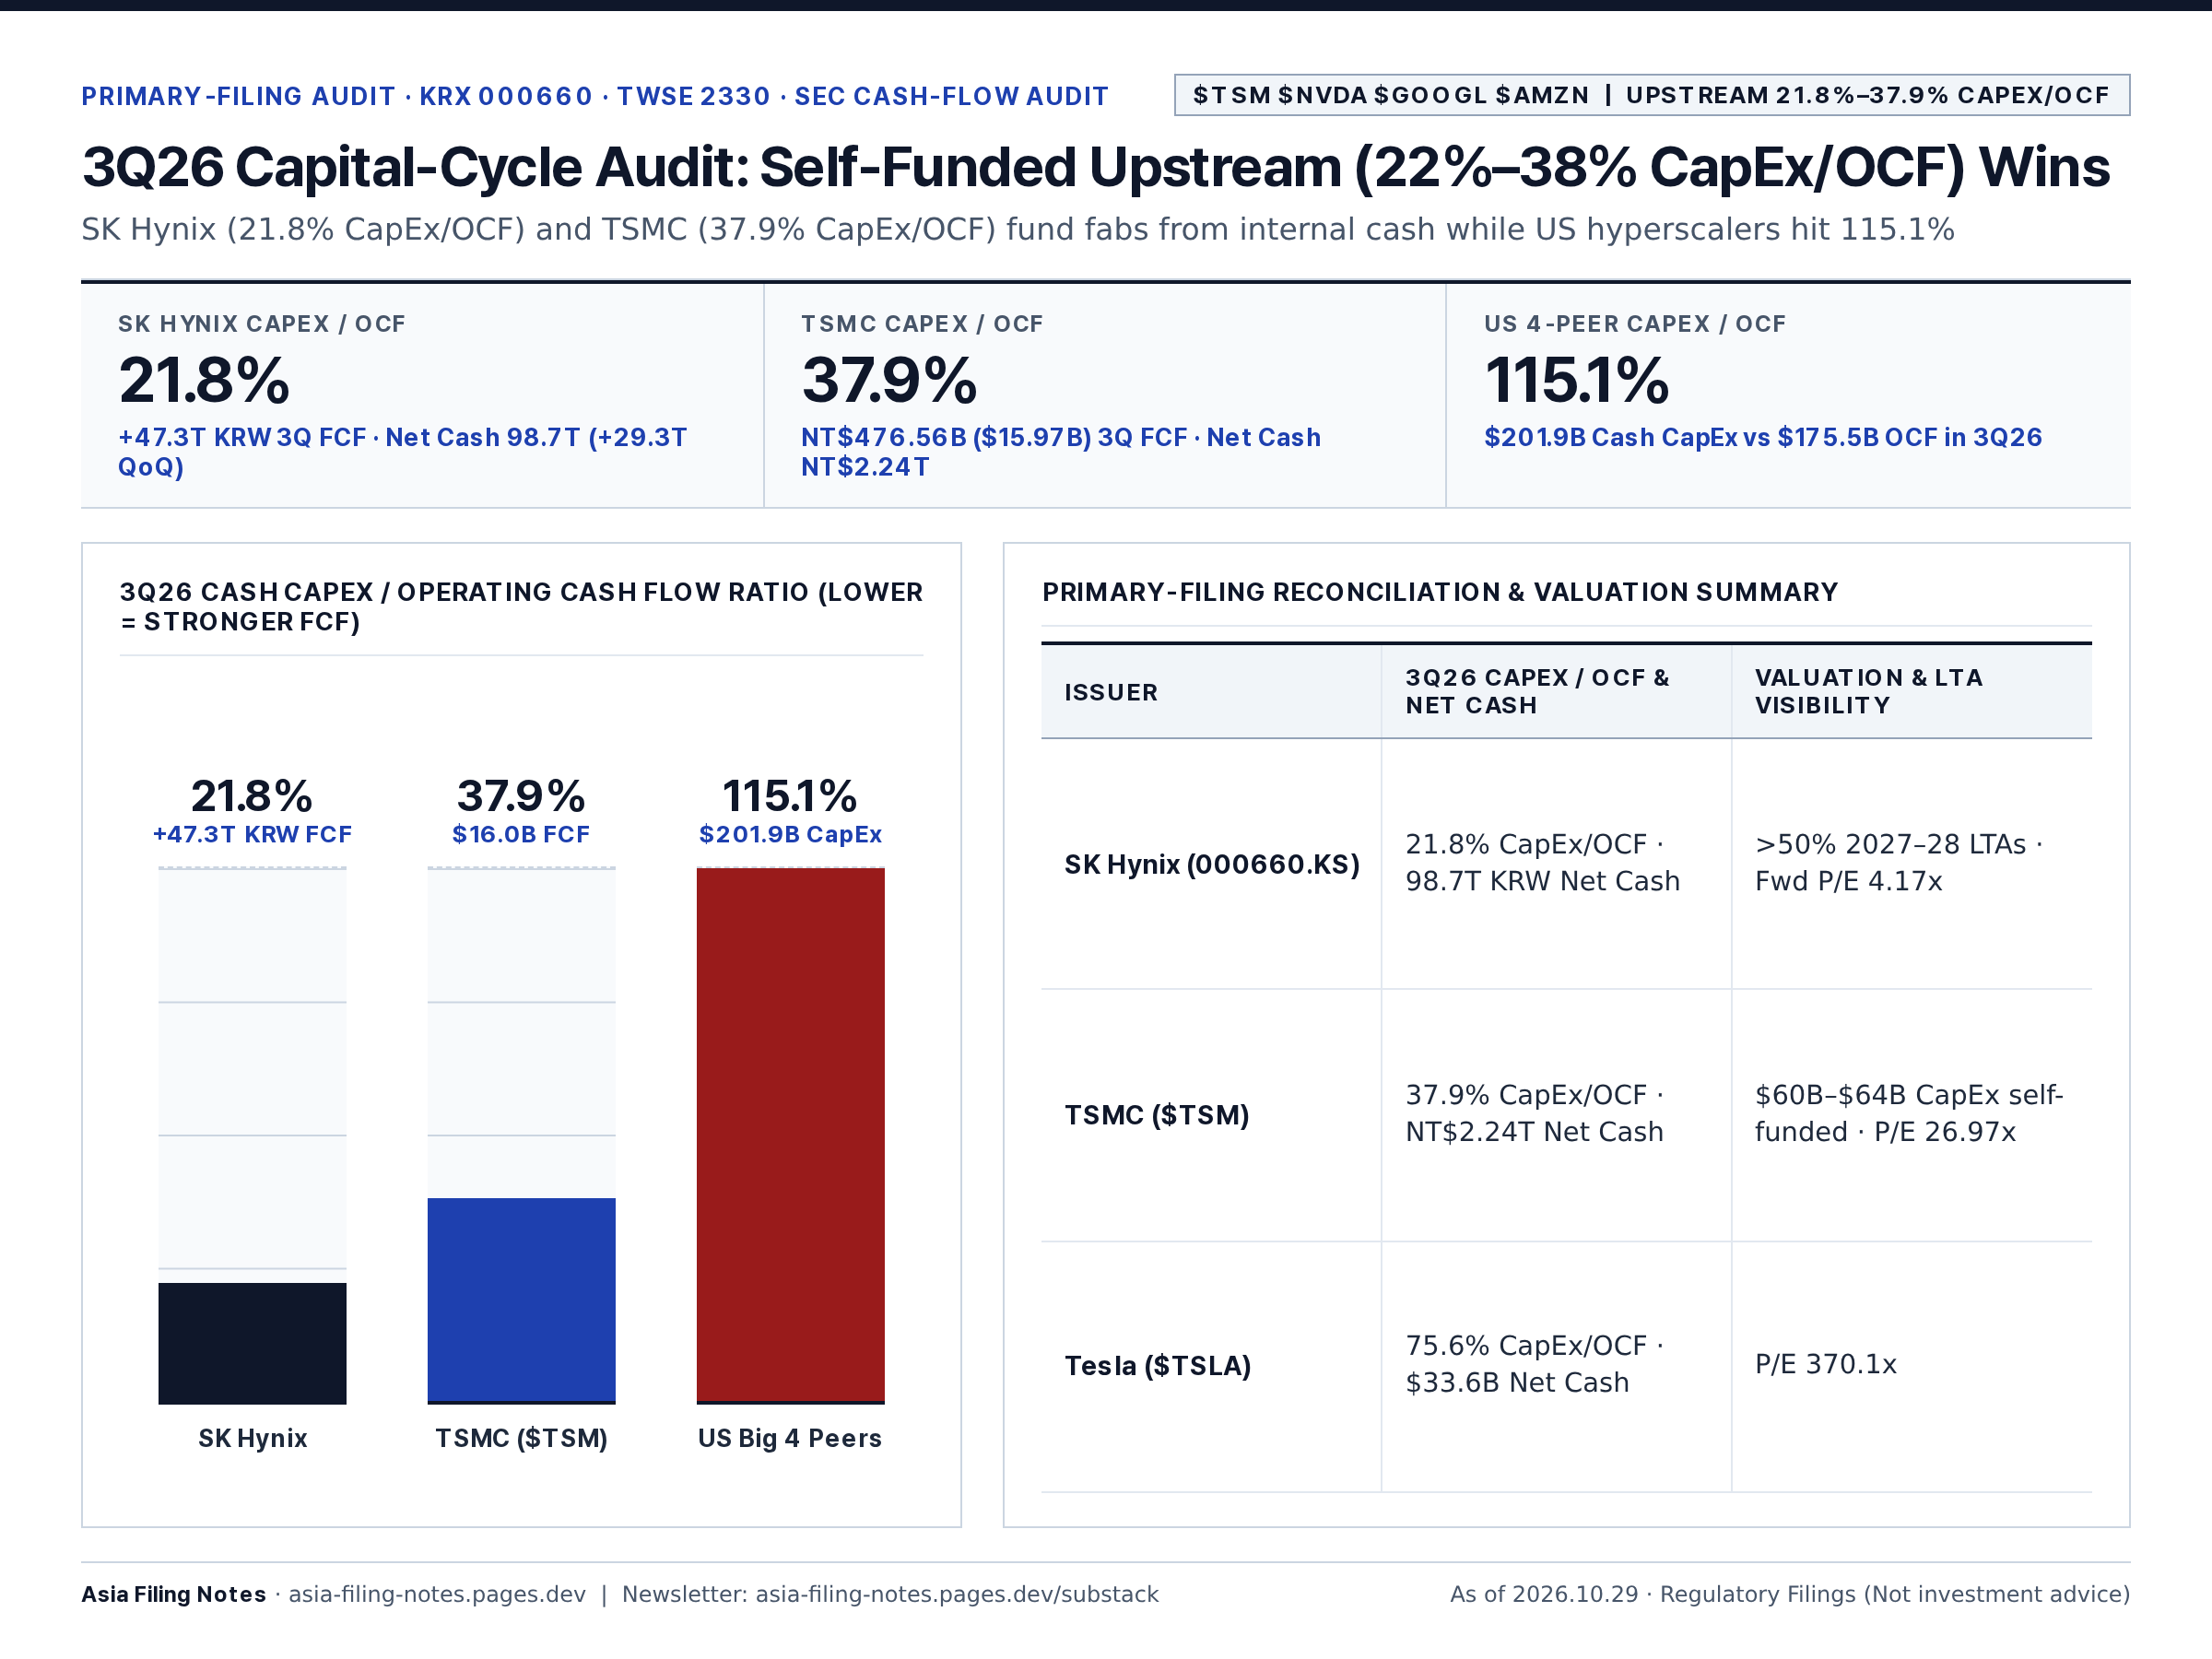
#13 · $TSM $NVDA $GOOGL $AMZN
Upstream 21.8%–37.9% CapEx/OCF
3Q26 Capital-Cycle Audit: Self-Funded Upstream (22%–38% CapEx/OCF) Wins
FinTwit Vertical Bullet Post (259/280 chars · 100% English)
3Q26 AI Capital-Cycle Cash Flow Audit (CapEx as % of OCF):

• #SKHynix ($HXSCL / 000660.KS): 21.8% CapEx/OCF (+47.3T KRW FCF)
• $TSM: 37.9% CapEx/OCF ($15.97B 3Q FCF)
• US Hyperscalers ($GOOGL $AMZN $MSFT $META): 115.1% CapEx/OCF

Self-funded compounders win.
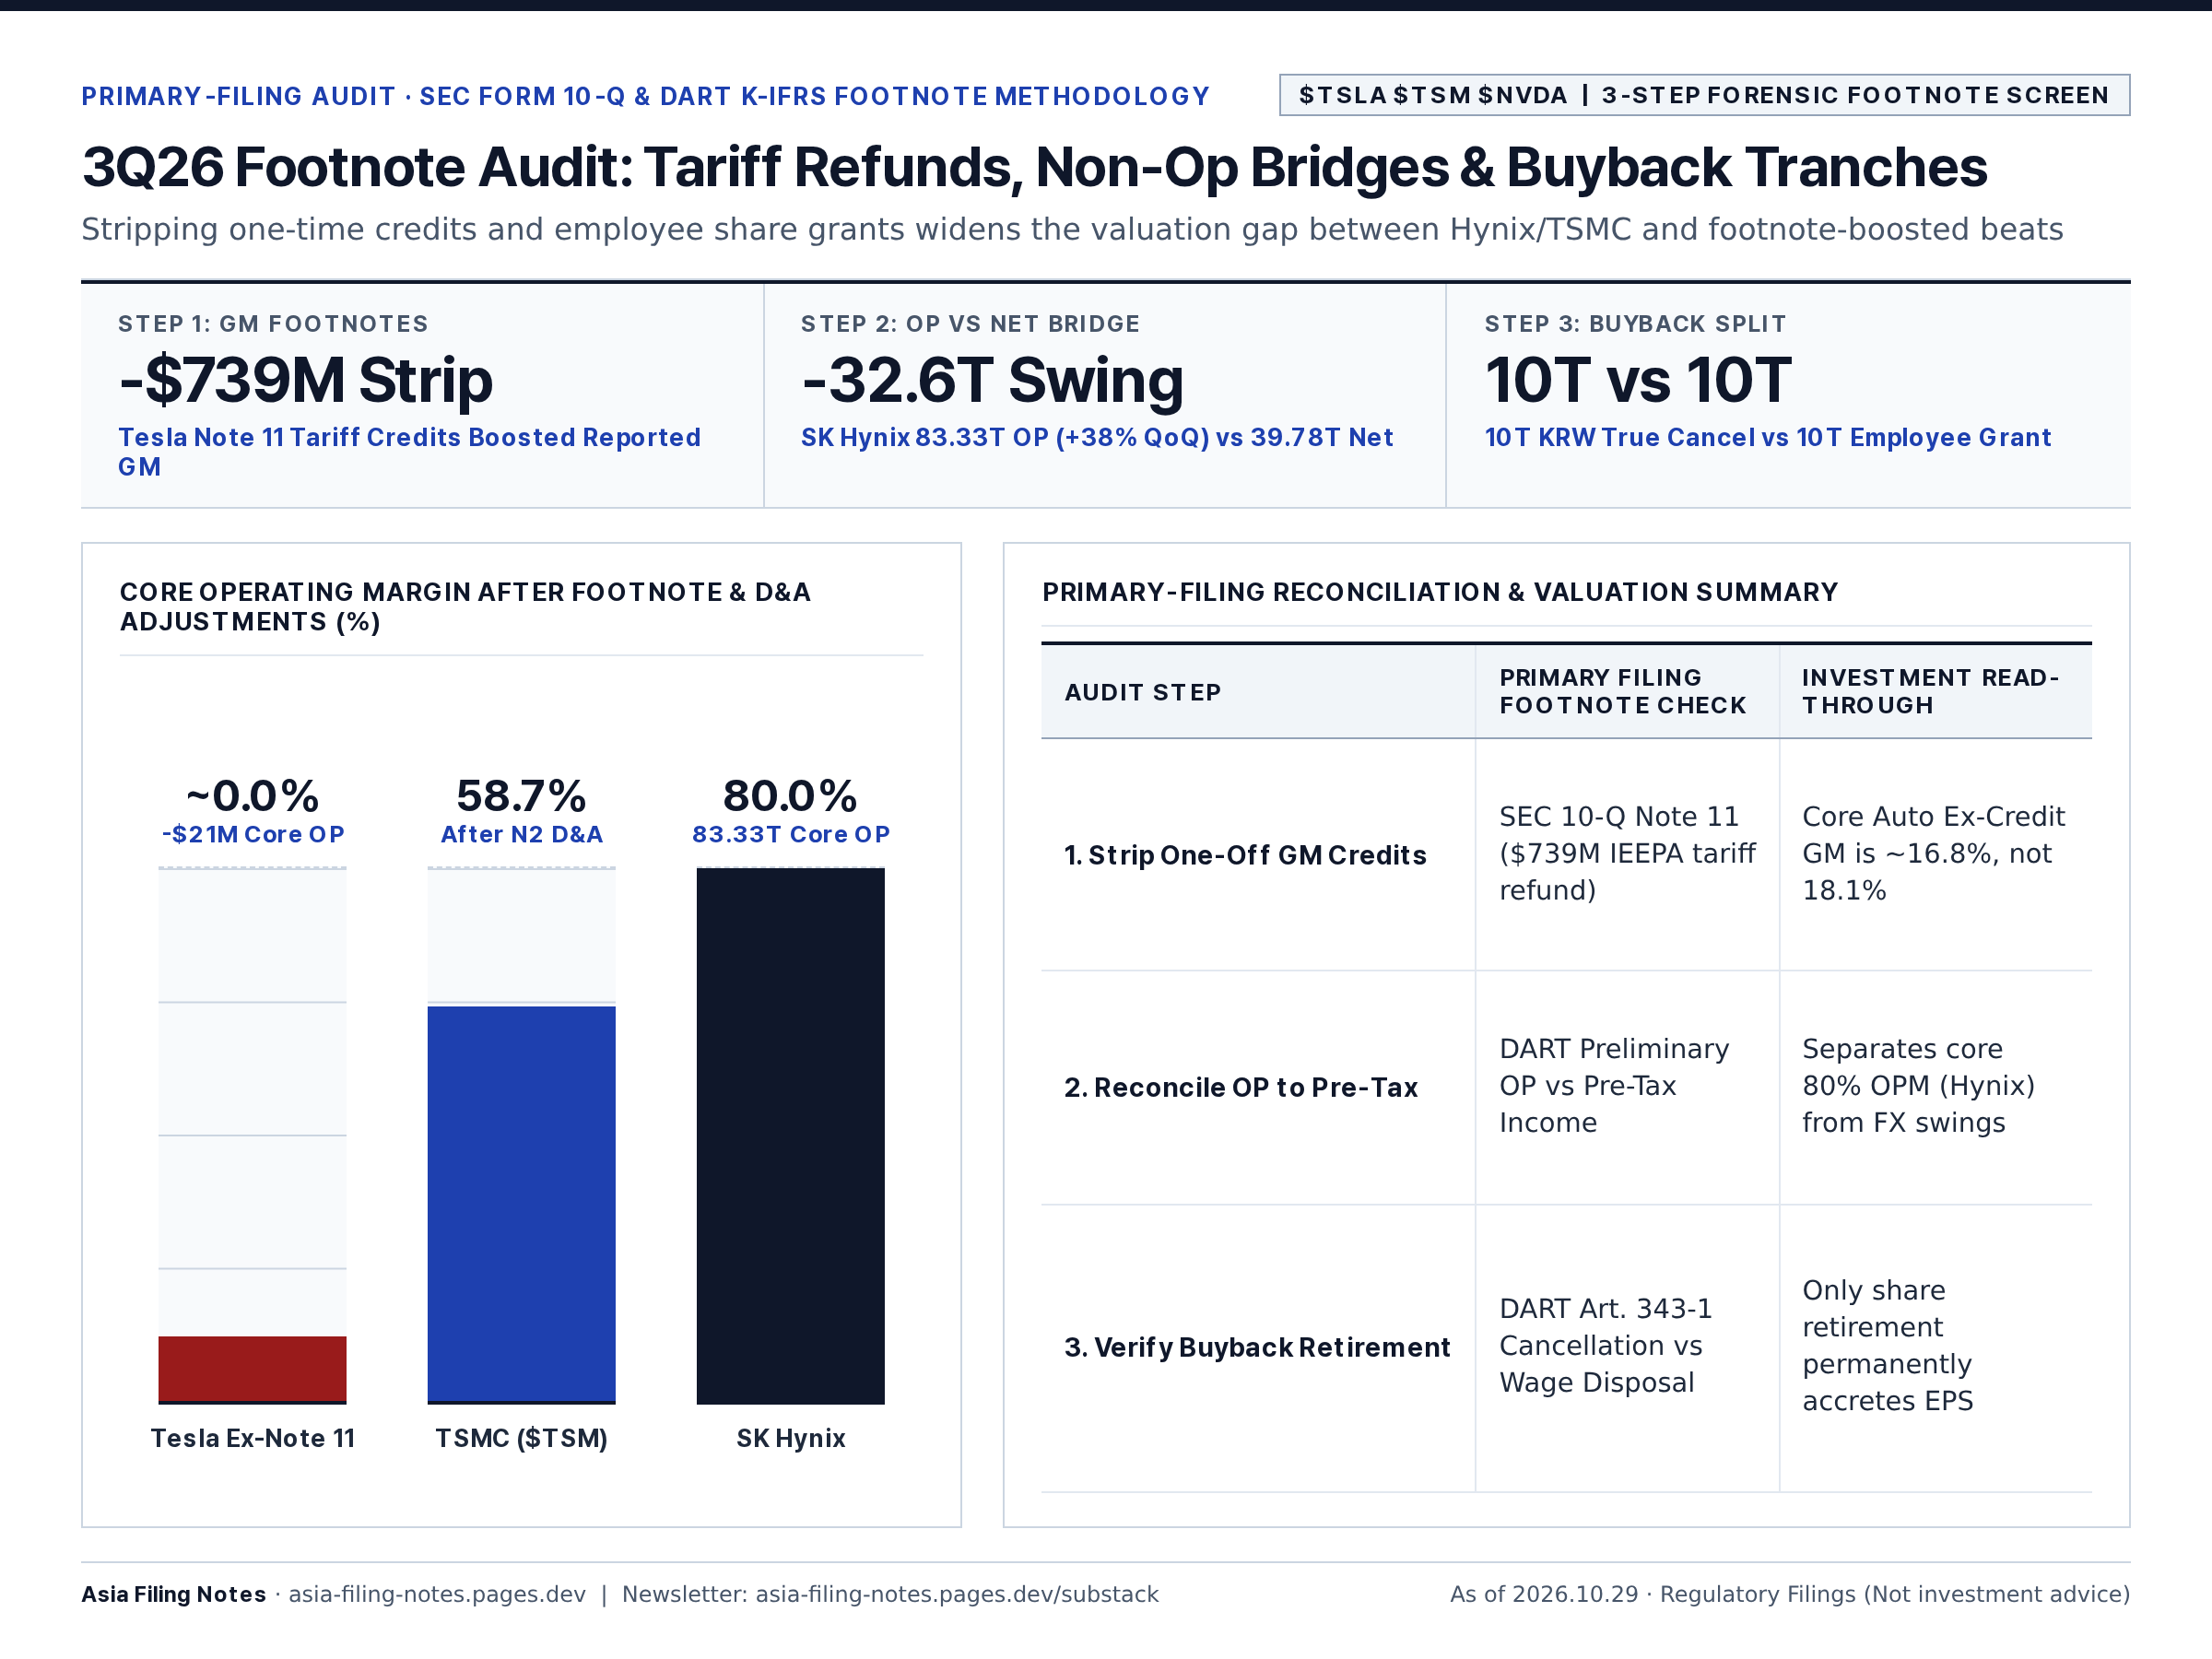
#14 · $TSLA $TSM $NVDA
3-Step Forensic Footnote Screen
3Q26 Footnote Audit: Tariff Refunds, Non-Op Bridges & Buyback Tranches
FinTwit Vertical Bullet Post (269/280 chars · 100% English)
3-Step Forensic Footnote Checklist for 3Q26 Earnings:

• Step 1: Strip one-off GM credits ($TSLA Note 11 $739M tariff refund)
• Step 2: Bridge Operating Profit to Pre-Tax FX swings (DART K-IFRS)
• Step 3: Separate true share retirement from employee grants ($TSM $NVDA)
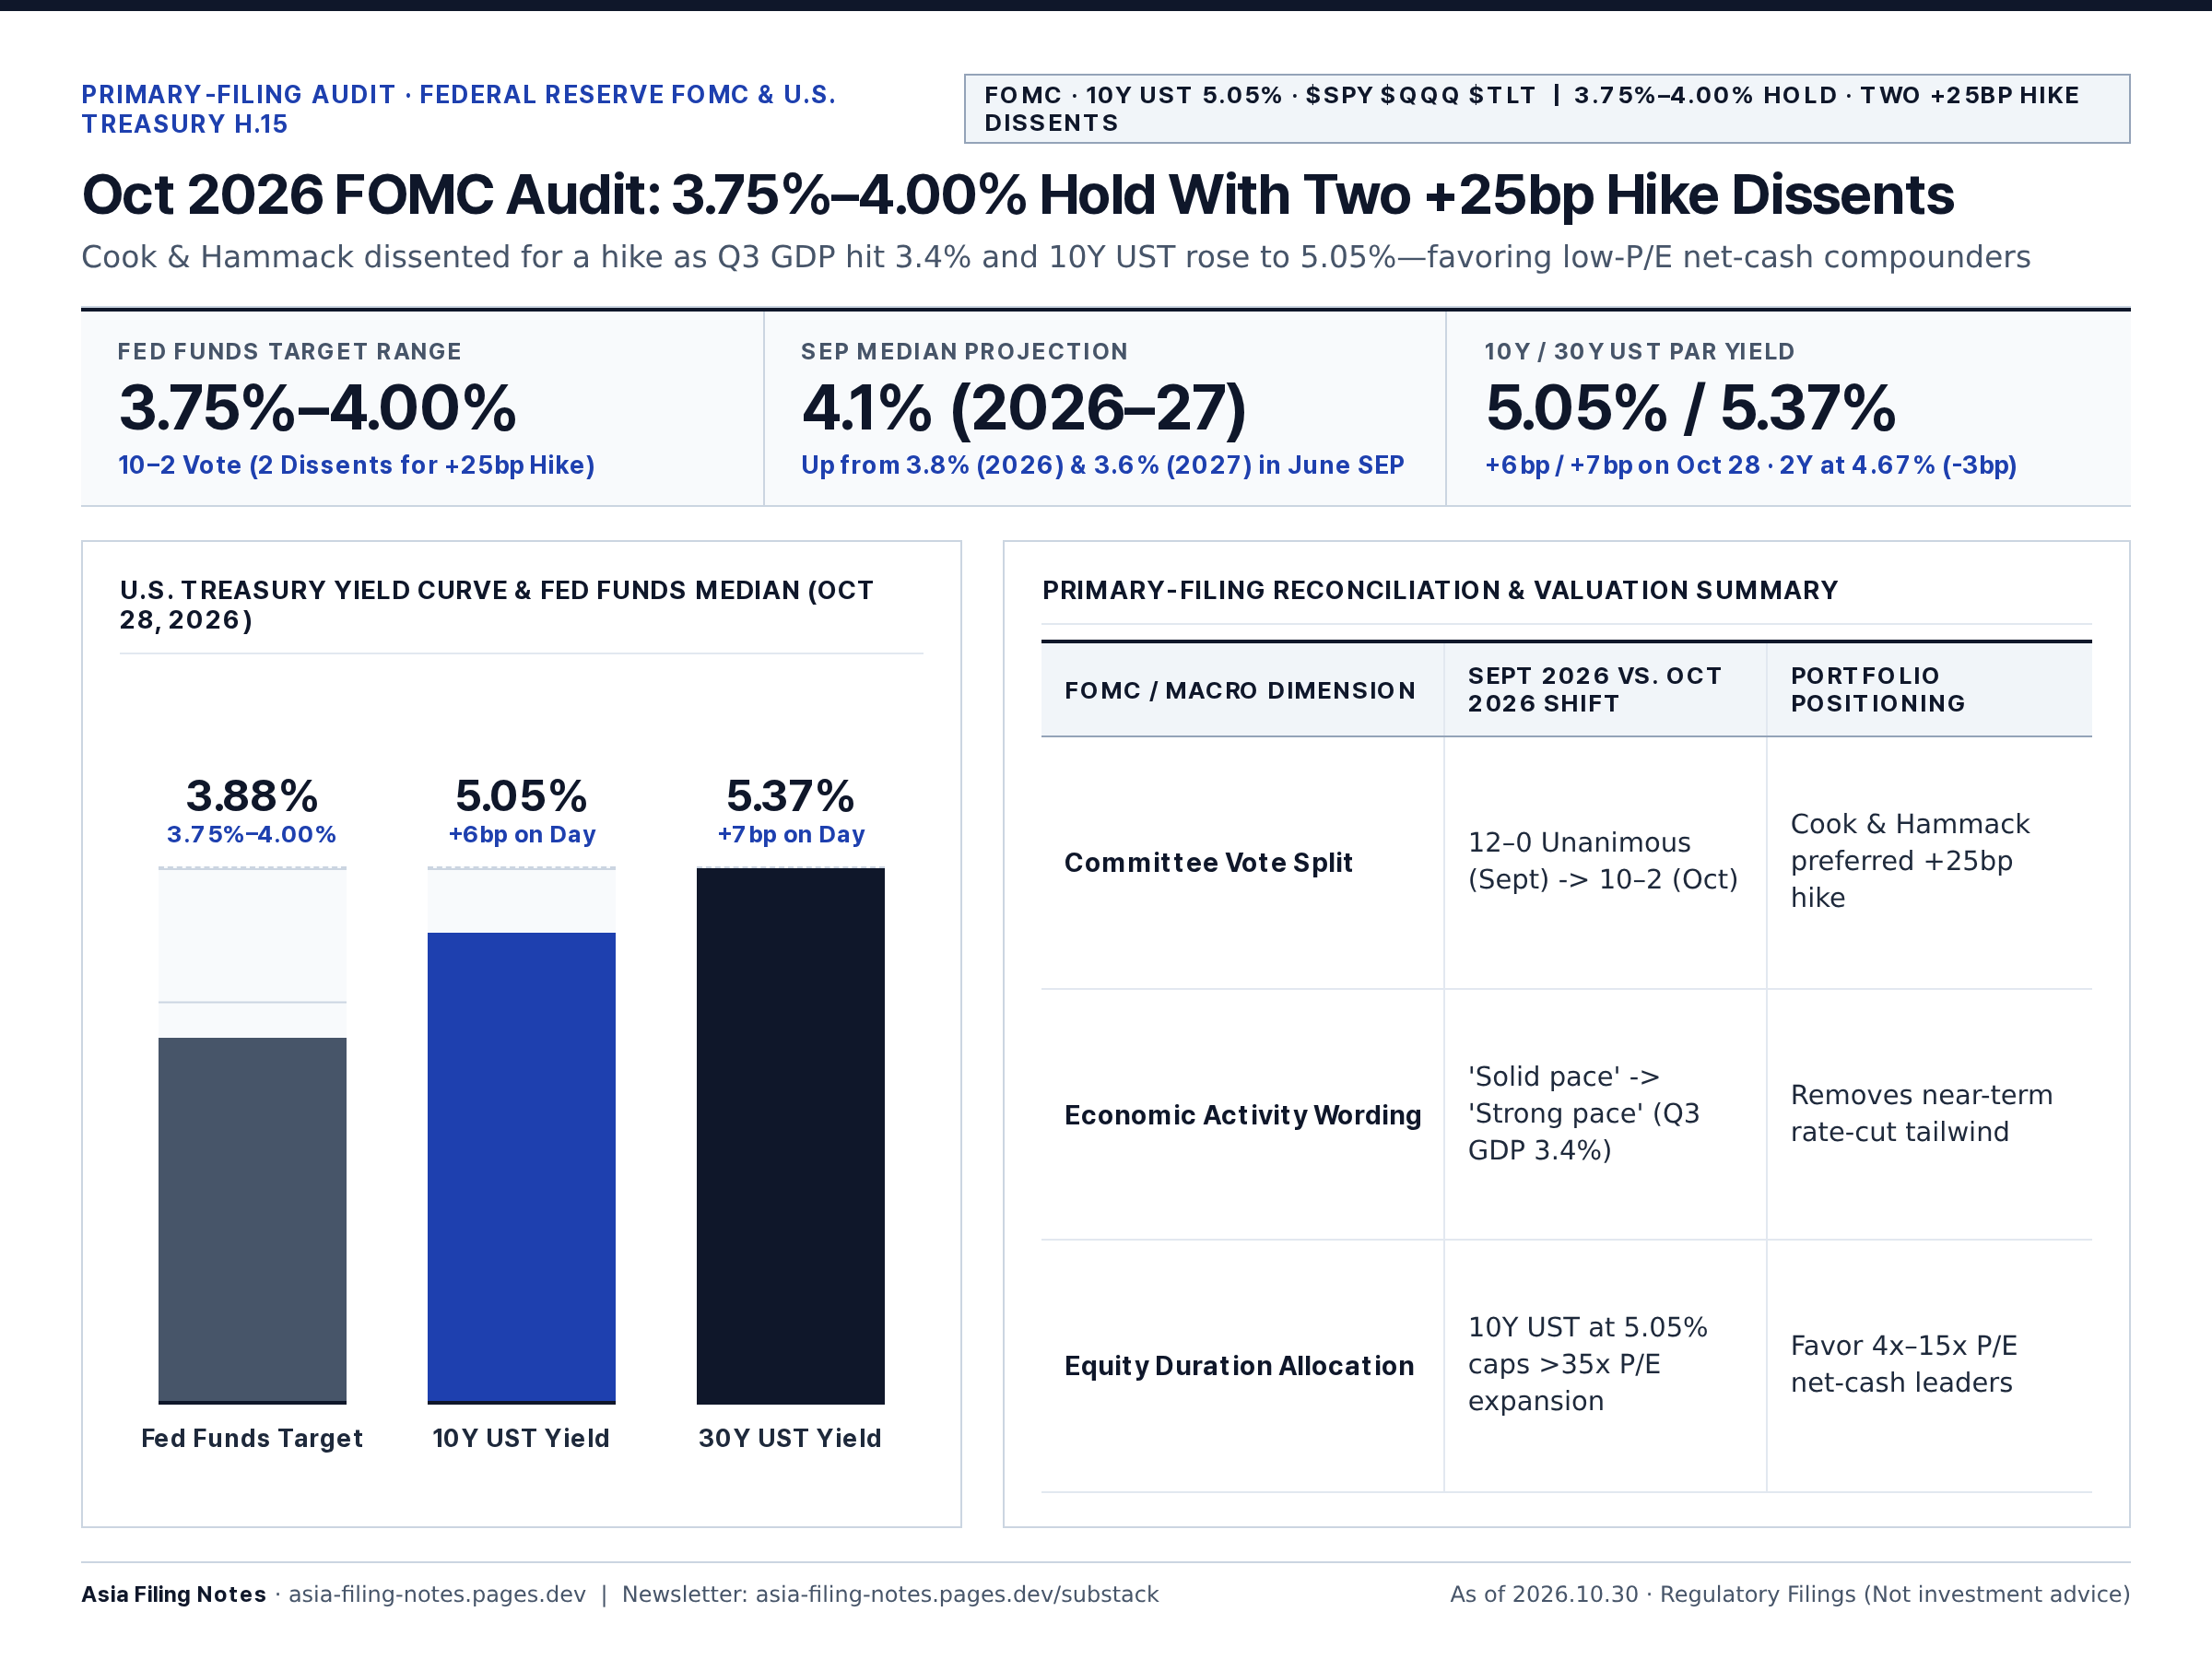
#15 · FOMC · 10Y UST 5.05% · $SPY $QQQ $TLT
3.75%–4.00% Hold · Two +25bp Hike Dissents
Oct 2026 FOMC Audit: 3.75%–4.00% Hold With Two +25bp Hike Dissents
FinTwit Vertical Bullet Post (256/280 chars · 100% English)
October 2026 FOMC Statement & Treasury Curve Audit:

• Fed Funds: 3.75%–4.00% hold (10–2 vote; 2 hike dissents)
• Growth Wording: Upgraded to 'strong' (Q3 GDP 3.4%)
• Yields: 10Y UST at 5.05%, 30Y at 5.37%

Favors low-P/E net-cash leaders ($SPY $QQQ $TLT).